Download
1 / 29
290 likes | 418 Vues
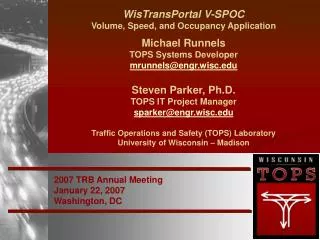
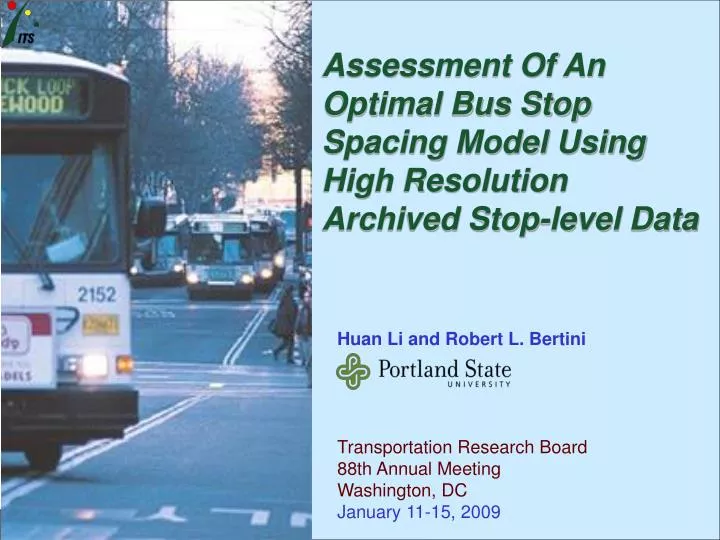
Assessment Of An Optimal Bus Stop Spacing Model Using High Resolution Archived Stop-level Data. Huan Li and Robert L. Bertini Transportation Research Board 88th Annual Meeting Washington, DC January 11-15, 2009. About TriMet. Serves 1.2 M population 63.9 M annual bus trips 95 bus routes

E N D
Assessment Of An Optimal Bus Stop Spacing Model Using High Resolution Archived Stop-level Data Huan Li and Robert L. Bertini Transportation Research Board 88th Annual Meeting Washington, DC January 11-15, 2009
About TriMet • Serves 1.2 M population • 63.9 M annual bus trips • 95 bus routes • 655 buses • 8100 bus stops • Also LRT, Commuter Rail, Streetcar & Paratransit
Navstar GPS Satellites TriMet’s Bus Dispatch System Radio System Radio Antenna GPS Antenna Doors Lift APC (Automatic Passenger Counter) Overhead Signs Odometer Signal Priority Emitters Stop Annunciation On- Board Computer Control Head MemoryCard Radio Garage PC’s
TriMet’s Bus Dispatch System Infrared APC Schedule deviation Operator Input Control Head PCMIA Card Dispatching Arrival Prediction
One Year Stop-Level Data (2007) • Route Number • Vehicle Number • Service Date • Actual Leave Time • Scheduled Stop Time • Actual Arrive Time • Operator ID • Direction • Trip Number • Bus Stop Location • Dwell Time • Door Opened • Lift Usage • Ons & Offs (APCs) • Passenger Load • Maximum Speed on Previous Link • Distance • Longitude • Latitude
Background on Stop Location Challenges in delivering reliable and timely bus service Financial constraints Public transit operational issues Transit service generally favors bus stop accessibility Sometimes based on past history and tradition rather than rigorous ongoing analysis at the stop level
Stop Spacing Service Standards TriMet • Portland • >80 units/acre: 400-600 ft • 22-80 units/acre: 500-750 ft • 4-22 units/acre: 600-1000 ft • <4 units/acre: as needed • Inner Portland has 200 ft blocks (264 ft street spacing) • Route 19 mean stop spacing is 942 ft (3 blocks) Objective: Develop and test a simple stop spacing model using this rich data
Concept Derivation Trade off: person’s time in parallel access vs. another person’s time in riding. Minimize access cost: favors small s Minimize riding cost: favors large s
Assumptions Origins & destinations distributed along route in one dimension (ignore perpendicular access)… • Average access distance (parallel only) =s/4 • Assume number of passengers boarding or alighting at a stop to be ~Poisson distributed
Access Cost Riding and Stopping Cost
Access Cost Value of Passenger Travel Distance p = density of trip origins plus density of trip destinations for passengers who board or alight the same vehicle (units: number/distance) s/4= average access distance (unit: distance) ν = passenger access speed (unit: distance/time) a = average cost per unit time per person for access (unit: cost/time) [avg. dist traveled] Ca= [avg. no. of pax] [cost/unit dist] in interval of lengths
Access Cost Riding and Stopping Cost
Riding and Stopping CostValue of in-vehicle passenger lost time due to boardings and alightings N = expected number of passengers on vehicle V = vehicle cruise speed = time lost in stopping to serve passengers Pr=1-e-ps = probability that vehicle actually stops (from Poisson for number of ons and offs) γr= average cost per unit time per person for riding Cr= [avg. no. of pax] [riding time + lost time] [cost/unit time] in interval lengths
Average Cost Per Unit Length ps ps ( 1 e ) - - + ps b [access] + [riding] + [stopping] Average cost per unit length = [ ] / s Given that = Average cost per unit length Independent of s! Choice of s is independent of V, depends solely on
Objective Function Coverage for >2 If β > 2:
ps = expected number of passengers to board or alight per stop
Case Study: Inbound Route 19 All Day 370 days (2/20/07 - 1/5/08) 19,344 trips 33.2 ons and offs/trip: Average passenger load/stop: 7.9 • Route 19 Glisan to Portland • Route Length: 9.27 mi • Number of stops: 52 • Mean delay due to stopping: 33.6 s • Use 4ft/s walking speed
Optimized Spacing Calculation N = 7.9 pax/stop • No. of passengers on vehicle • Passenger ons and offs • Lost time ps = 33.2 pax/trip =33.6sec
2007 Time Space Passenger Load Plot Route 19 9 8 7 6 5 4 3 2 1 0 30 25 20 15 10 5 0 Distance (mi) 5 10 15 20 Time (hour)
2007 AM Passenger Load Plot Route 19 AM Peak Analysis • Direction: all inbound trips • Analyzed time period: AM peak hours (6:00-9:00 defined by TriMet) in weekdays • Number of trips: 3,658 • Mean headway in peak hour: 12 minutes • Mean trip time: 32.6 min 2007 AM Passenger Ons&Offs Plot Route 19
AM Peak Analysis Optimal
Conclusions • 12(14) stops are recommended for consolidation • The trip time would be reduced by 3.4 (4.0)min/trip • The total savings due to consolidation could be up to 3.7 (4.4)hours of service time per day • Allow the addition of approximately 7.6(9) additional trips per weekday • Mean weekday headway would drop from 18.0 min to 16.1(15.8) min • Total of 17,076 inbound trips, the time saved would be 980 (1140)hours during the year • Assuming $60/hr operating cost, about $60,000($68,000)could be saved by TriMet
Next Steps • Automate process for all routes • Produce quarterly reports for TriMet • Verify “real” cost savings • Check model assumptions (e.g. Poisson) • Consider “real” relationship to demand and equity • Connect to scheduling
Acknowledgements • David Crout of TriMet for providing the rich data set that facilitated this analysis • Prof. Gordon Newell • Prof. Michael Cassidy, University of California at Berkeley, for his assistance in developing the analytical framework for this paper huanl@pdx.edu www.its.pdx.edu