Download
1 / 37
370 likes | 514 Vues
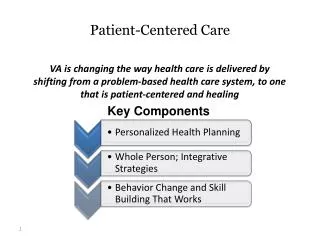
Assuring Safety and High-Quality, Patient Centered Services Along the Continuum of Perinatal Care. Secretary’s Advisory Committee on Infant Mortality November 14, 2012. Data-Driven Perinatal Quality Improvement Through Public-Private Partnering. Elliott K. Main , MD Director, CMQCC

E N D
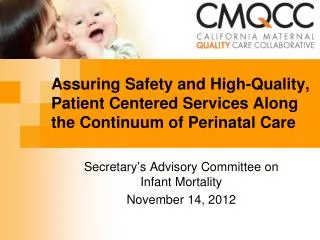
Assuring Safety and High-Quality, Patient Centered Services Along the Continuum of Perinatal Care Secretary’s Advisory Committee on Infant Mortality November 14, 2012
Data-Driven Perinatal Quality Improvement • Through Public-Private Partnering Elliott K. Main, MD Director, CMQCC Chair, Dept. OB/GYN, California Pacific Medical Center Clinical Professor, Dept. OB/GYN, Univ. Calif. San Francisco Visiting Professor, Dept OB/GYN, Stanford University
California…. • 2011 Population: 37,691,912 1 • 3 large metropolitan areas, but extensive remote rural areas • 2011 Births: 502,118 2 • 1 of 8 US births, Texas next with 377k • Equal to a large European country • 2010 Infant Mortality: 4.7 / 1,000 3 • ~4th lowest state in US, but still ~27th in the world • 2011 Preterm Birth Rate: 9.8% 4 (March of Dimes: “B”) • Currently ~280 birthing facilities with >50 annual births 1 US Census Bureau (est.), June 2011 2 NCHS: NVSR 61:05, Oct 2012 3 CDPH: MCAH, May 2012 4 NCHS: 2011 Preliminary Natality data
Improving Maternity Outcomes Faster change? Easier to test? Cheaper?
How does Data-Driven QI improve maternal and neonatal outcomes? • Multi-Stakeholder Quality Collaboratives • State-wide perinatal outcomes database • Significant effort for Data Quality • Using transparent data to drive and incent care • Pos: 50 states testing new ideas • Neg: 50 states all “doing their own thing”
CMQCC and CPQCC Mission: Data-driven QI for mothers and newborns California Perinatal Quality Care Collaborative (CPQCC) • Established 1996 • >95% of all Neonatal Intensive Care Units in California • Secure data center—pioneer for data driven QI • Model of working with state agencies to provide data of value California Maternal Quality Care Collaborative (CMQCC) • Established 2006 • California Maternal Mortality Review Committee (Title V, MCAH) • QI toolkits: Elective Delivery <39wks, Hemorrhage, Preeclampsia, • Large-scale QI Collaboratives: Hemorrhage, Preeclampsia • Statewide Maternal Data Center (CDC and CHCF supported)
CMQCC Key Partner/Stakeholders State Agencies: • MCAH, Dept Public Health • OSHPD Healthcare Information Division • Office of Vital Records (OVR) • Regional Perinatal Programs of California (RPPC) • DHCS, Medi-Cal Public Groups • California Hospital Accountability and Reporting Taskforce (CHART) • Kaiser Family Foundation • March of Dimes (MOD) • Pacific Business Group on Health Professional groups • American College of Obstetrics and Gynecology (ACOG) • Association of Women’s Health, Obstetric and Neonatal Nurses (AWHONN) • American College of Nurse Midwives (ACNM), • American Academy of Family Physicians (AAFP) Key Medical and Nursing Leaders • University and Hospital Systems • Kaisers, Sutter, Sharp, CHW, Scripps, Public hospitals,
Examples of Current Maternal QI Projects • VLBW (<1500g) infants to deliver at appropriate level of care (Level III NICU) • Early (<39 weeks) Elective Delivery • Reducing Low-risk First-birth Cesareans • Increasing Exclusive Breast Milk Feeding • Reduction of complications in pregnant women with hypertension
Regionalization of care for VLBW has diminished in the last decade despite strong evidence of benefit • California has large variation with major quality opportunities in urban areas
VLBW infants (<1500g) Admitted Directly to NICU MMWRNov 12, 201059:144-7
Delivery of <1500gm Infant NOT at a Level III Center HP 2010, HP 2020, • Turn the national goal into a hospital-level quality measure • CMQCC Sponsored • NQF Endorsed • <1500g infant not delivered at an appropriate level of care • Denominator: Livebirths >24 weeks gestation at a NON-Level III hospital • Numerator: Births <1500gm and >500gms • Exclusions: none • Risk Adjustment: none
Large Regional and Hospital Variation for the Delivery of VLBW not in an Appropriate Level of Care
The California Maternal Data Center (CMDC) Project Vision • Build a statewide data center to collect and report timely maternity metrics—in way that islow cost, low burden and high valuefor hospitals • Produce metrics that will support QI and L&D service line management • Improve quality of administrative data • Facilitate reporting to national performance organizations • Over time, publicly report select set of robust measures to inform decisions of childbearing women
CMQCC Maternal Data Center: Data Flow PDD--Discharge Diagnosis File (ICD9 codes) Birth Certificate File (Clinical Data) Uploads electronic files • Links Birth Data to OSHPD file • Runs exclusions • 3. Identifies CS and Inductions • 4. Prints list of charts for review CMQCC Data Center Limited manual data entry for this measure Calculates all the Measures <39wk Elective DeliveryCHART REVIEW Labor?/SROM? (~6% of cases for brief review) REPORTSBenchmarks against other hospitals Sub-measure reports Mantra: “If you use it, they will improve it”
Comprehensive Vision for Maternal Data QI in California • Standardize Definitions • Education (MD’s, BC staff, Coders) • Redesign / System Changes • Improving Data as QI Project • Create Value for Maternal Data QI for hospitals
Obstetric Data Definitions Project National Meeting August 2-3, 2012 Arlington, Virginia
Project Objectives • To nationally standardize obstetric clinical data definitions. • To educate and advocate for national implementation of the standardized obstetric data elements and definitions in electronic medical records, birth certificates, and data registries • To increase and improve performance measurement and implementation of the national obstetric data standards and encourage data aggregation.
Many Stakeholders… • National vital records (NCHS, NAPHSIS) • State vital records • State departments of health (MCH) • Federal agencies (CMS, CDC, NLM, AHRQ, NICHD) • Quality organizations (TJC, Leapfrog, NQF) • Health IT / Coding organizations • EMR vendors • Payers (Medicaid and commercial) • Providers (obstetrics, family medicine, nursing, midwifery) • Large scale QI collaboratives • Advocacy groups (March of Dimes)
Data Quality Reports • Identify discrepancies or missing data in Birth Certificate and Discharge data files • Use to target data performance/quality improvement Screen shot from the California Maternal Data Center
Data Quality Reports • Identify discrepancies or missing data in Birth Certificate and Discharge data files • Use to target data quality improvement
A hospital with a system for transferring clinical data to the BC
Late Preterm Birth (34+0 to 36+6 wks) • Late Preterm Birth makes up >70% of all PTB • Late Preterm Birth accounted for ~80% of the rise in PTB in the prior 10 years • Late Preterm Birth accounts for 75% of the decline in PTB in the last 3 years • Late Preterm Birth accounts for much of the variation in PTB rates among states and among hospitals • Is there a QI opportunity here?
Health Equity • <1500g Birth Not at Appropriate Location • Late Preterm Birth • Exclusive Breast Milk during Birth Hospitalization • Low-risk First Birth Cesarean Delivery All have significant racial/ethnic disparities All could be helped by focused QI projects
Recipe for Improving Care Quality Measures Define the Issues Locally Hospital Level Provider Level Public Release Benchmarking Transparency Incent Systems Change Pos/Neg Incentives Value-Based Purchasing Financial Unintended Consequences? Balancing Measures! Data quality? If you use it, they will improve it!
Role(s) for HHS Support measure development Support wide-spread use Support data collaboratives Quality Measures Support public release Raise awareness Transparency Reduce perverse incentives Explore positive incentives Value-Based Purchasing Financial Support development of Balancing Measures Support Data QI projects Use admin data and they will improve it!
Thank You! main@CMQCC.org
Reporting Mandates Coming • ED<39 weeks measure included in Hospital IQR Program for FY 2015 payment determination: data collection beginning with January 2013 discharges • The Joint Commission will require reporting of perinatal set for hospitals that perform deliveries • Medicaid Adult Measure Set published; Medi-Cal Quality Dashboard under development • Medi-Cal has received a federal grant to test collection and reporting of perinatal metrics. CMDC is an active participant.
CMDC’s Clinical Quality Measures Current Soon Requires some additional chart review (minimized by using the CMDC)
CMDC’s Clinical Quality Measures Current Soon Requires some additional chart review (minimized by using the CMDC)
Median Cesarean Rate (%) California PerinatalRegion (2007 data)
Improving Maternity Outcomes: CMQCC Interactions with National Projects JC, NQF, NPP AMA PCPI Medi-Cal AdvisCMS Expert Panel ACOG reVITALize NAPHSISNCHS CDC/AMCHPACOG/CDC MCHB