Download
1 / 22
220 likes | 321 Vues
Electricity markets, perfect competition and energy shortage risks. Electric Power Optimization Centre. Andy Philpott Electric Power Optimization Centre University of Auckland. http://www.epoc.org.nz. joint work with Ziming Guan, Roger Wets, Michael Ferris. The University of Auckland.

E N D
Electricity markets, perfect competition and energy shortage risks Electric Power Optimization Centre Andy Philpott Electric Power Optimization Centre University of Auckland http://www.epoc.org.nz joint work with Ziming Guan, Roger Wets, Michael Ferris The University of Auckland
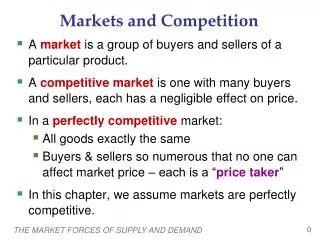
Electricity markets and perfect competition "Private market disciplines are important in competitive industries. And the energy market is becoming increasingly competitive. And the government, in our experience, is not an adaptable, risk-adjusted 100 per cent owner of assets in competitive markets.“ Bill English, NZ Minister of Finance, Energy News, Nov. 9. Electric Power Optimization Centre Q: How competitive is the market? Q: How can you tell? The University of Auckland
Dry winters and prices Electric Power Optimization Centre The University of Auckland
Research question Electric Power Optimization Centre What does a perfectly competitive market look like when it is dominated by a possibly insecure supply of hydro electricity? The University of Auckland
An equilibrium result Suppose that the state of the world in all future times is known, except for reservoir inflows that are known to follow a stochastic process that is common knowledge to all generators. Suppose that, given electricity prices, these generators maximize their individual expected profits as price takers. There exists a stochastic process of market prices that gives a price-takingequilibrium. These prices result in generation that maximizes the total expected welfare of consumers and generators. So the resulting actions by the generators maximizing profits with these prices is system optimal. It minimizes total expected generation cost just as if the plan had been constructed optimally by a central planner. Electric Power Optimization Centre The University of Auckland
Solve a year-long hydro-thermal problemto compute a centrally-planned generation policy, and simulate this policy. We use DOASA, EPOC’s implementation of SDDP. We account for shortages using lost load penalties. In our model, we re-solve DOASA every 13 weeks and simulate the policy between solves using a detailed model of the system. We now call this central. includes transmission system with constraints and losses river chains are modeled in detail historical station/line outages included in each week unit commitment and reserve are not modeled An annual benchmark Electric Power Optimization Centre The University of Auckland
HAW MAN WKO Long-term optimization model demand demand N Electric Power Optimization Centre H S The University of Auckland demand
HAW MAN WKO We simulate policy in this 18-node model Electric Power Optimization Centre The University of Auckland
Historical vs centrally planned storage Electric Power Optimization Centre The University of Auckland 2005 2008 2006 2007 2009
Additional annual fuel cost in market Total fuel cost = (NZ)$400-$500 million per annum (est) Total wholesale electricity sales = (NZ)$3 billion per annum (est) Electric Power Optimization Centre The University of Auckland
South Island prices over 2005 Electric Power Optimization Centre The University of Auckland
South Island prices over 2008 Electric Power Optimization Centre The University of Auckland
Historical vs centrally planned storage Electric Power Optimization Centre The University of Auckland 2005 2008 2006 2007 2009
Measuring risk The system in each stage minimizes its fuel cost in the current week plus a measure of the future risk.(Shapiro, 2011; Philpott & de Matos, 2011) For two stages (next week’s cost is Z) this measure is: r(Z) =(1-l)E[Z] + lCVaR1-a[Z] for some l between 0 and 1 Department of Engineering Science Electric Power Optimization Centre The University of Auckland The University of Auckland
Value at risk VaR1-a[Z] frequency a=5% Electric Power Optimization Centre cost The University of Auckland VaR0.95 = 150
Conditional value at risk (CVaR1-a[Z]) frequency Electric Power Optimization Centre cost The University of Auckland CVaR0.95 = 162
Recursive risk measure For a model with many stages, next week’s objective is the risk r(Z) of the future cost Z, so we minimize fuel cost plus (1-l)E[r(Z)] + lCVaR1-a[r(Z)] for some l between 0 and 1. Here r(Z) is a certainty equivalent: the amount of money we would pay today to avoid the random costs Z of meeting demand in the future.(It is not an expected future cost) Electric Power Optimization Centre The University of Auckland
Simulated national storage 2006 Electric Power Optimization Centre The University of Auckland
Historical vs centrally planned storage Electric Power Optimization Centre The University of Auckland 2005 2008 2006 2007 2009
Some observations The historical market storage trajectory appears to be more risk averse than the risk-neutral central plan. When agents are risk neutral, competitive markets correspond to a central plan. so either… agents are not being risk neutral, or the market is not competitive. Question: Is the observed storage trajectory what we would expect from risk-averse agents acting in perfect competition? Electric Power Optimization Centre The University of Auckland
Ralph-Smeers Equilibrium Model What is the competitive equilibrium under risk? Assume we have N agents, each with a coherent risk measure riand random profit Zi. Electric Power Optimization Centre If there is a complete market for risk then agents can sell and buy risky outcomes. The equilibrium solves V(Z1,..) = min {Siri(Zi-Wi):Si Wi =0} Equivalent to using a system risk measure rs(SiZi) The University of Auckland Can compute equilibrium with risk-averse optimization.
Conclusion When agents are risk neutral, competitive markets correspond to a central plan. When agents are risk averse, competitive markets do not always correspond to a central plan. In general we need aligned risks, or completion of the risk market. This is true even if there is only one risk-averse agent. A new benchmark is needed for the multi-stage hydrothermal setting: risk-averse competitive equilibrium with incomplete markets for risk. Electric Power Optimization Centre The University of Auckland