Download
1 / 117
1.17k likes | 1.21k Vues
Join Dr. Sanjib Bandyopadhyay for a comprehensive course covering Descriptive Statistics, Central Tendency Measures, and more. Learn about Standard Deviation, Variance, and Frequency Distribution. Enhance your statistical skills now!

E N D
Basic Course in Statistics for Medical Doctors Dr. SanjibBandyopadhyay Assistant Director Medical Education Assistant Professor, Community Medicine, Calcutta National Medical College
About Statistical Class Some one said “If I had only one day to live, I would live it in my statistics class”
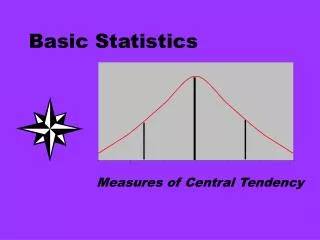
Descriptive Statistics Measures of Central Tendency Measures of Dispersion Range Variance Standard Deviation • Mean • Median • Mode
Measures of Central Tendency • We will study three measures of central tendency: • The mean, the preferred measure for interval data • The median, the preferred measure for ordinal data • The mode, the preferred measure for nominal and dichotomous data
Standard Error • Sample mean is an estimate of the population mean • Mean Blood Loss of 100 patients was 1240 ml (sd=553ml) • Can we say that the population mean is also 1240ml? • Uncertainty associated with our estimate 1240 ml • How do we measure the uncertainty?
Variance or Standard Deviation • On an average, how far each and every observation deviates from the mean. • About the study itself.
Standard Error • Take many samples of same size from the population asses the variability of such means • These means follow Normal Distribution • Mean of these means is the population mean • This variability can be estimated from a single study. • SE = σ̸√n or √ (pq/n)
SD vs SE • The contrast between these two terms reflects the important distinction between data description and precision/inference • SD : is a measure of variability and explains how widely scattered some measurements are in a group • SE : applicable for large samples & indicates the uncertainty around the estimate of the mean measurement
Standard Deviation • Description of data : • Example : • If the mean weight of a sample of 100 men is 72 kg and the SD is 8 kg. • Assuming normal distribution 68% of the men are expected to weigh between 64 and 80 kg.
Standard Error • 72 kg is also the best estimate of the mean weight of all men in the population. • How precise is the estimate 72 kg? • While testing hypothesis, Difference in mean or proportions between groups.
SAMPLE DATA SET Pt. No. Hb. Pt. No. Hb. Pt. No. Hb. 1 12.0 11 11.2 21 14.9 2 11.9 12 13.6 22 12.2 3 11.5 13 10.8 23 12.2 4 14.2 14 12.3 24 11.4 5 12.3 15 12.3 25 10.7 6 13.0 16 15.7 26 12.7 7 10.5 17 12.6 27 11.8 8 12.8 18 9.1 28 15.1 9 13.5 19 12.9 29 13.4 10 11.2 20 14.6 30 13.1
TABLE I FREQUENCY DISTRIBUTION OF • 30 ADULT MALE PATIENTS BY Hb • Hb (g/dl) No. of patients • 9.0 – 9.9 1 • 10.0 – 10.9 3 • 11.0 – 11.9 6 • 12.0 – 12.9 10 • 13.0 – 13.9 5 • 14.0 – 14.9 3 • 15.0 – 15.9 2 • Total 30
DIMENSION OF A TABLE • Dimension = No. of variables according to which • the data are classified • One-way Table - Freq. distn. of 30 adult male pts. by Hb • Two-way Table - Freq. distn. of 30 adult pts. by Hb & Sex • Three-way Table - Freq. distn. of 30 pts. by Hb, Sex & Age
ELEMENTS OF A TABLE • 1. Number (To refer ) • 2. Title (What, How classified, Where & When) • 3. Column headings (concise & clear) • 4. Foot-note (Headings, Special cell, Source)
A TYPICAL EXAMPLE OF A ONE-WAY TABLE • Table II • Distribution of 120 (Madras) Corporation Divisions according to annual death rate based on registered deaths in 1975 &1976 • Figures in parentheses indicate percentages SOURCE: Radhakrishna, S. et al (1983). Study of variation in area mortality rates in Madras city & its correlates. IJMR, 78, 732 – 739.
GUIDELINES TO PREPARE A TABLE • 1. Decide No. of classes (5 - 15) • 2. Decide Width of classes (Equal / Unequal) • 3. Decide class limits (Closed / Open ) • 4. Precise & Non-overlapping ( 9.0 - 9.9, 10.0 - 10.9 )
TYPES OF DIAGRAMS • Type of VariableDiagram • Qualitative or discrete Bar diagram • (religion, gender, Pie chart • place of residence) • Continuous • (height, weight, blood sugar ) Histograms • Line diagrams
Table 1 Distribution of blood group of patients of essential hypertension
Fig.-1 : Distribution of blood groups of patients with essential hypertension
Age group Male Female Total 1 to 10 12 11 23 11 to 20 25 22 47 21 to 30 18 18 36 31 to 40 20 22 42 41 to 50 17 15 32 Table 2: Sex-wise Distribution of studied population
PIE DIAGRAM • Considered for qualitative or discrete data • A circle is divided into different sectors • Areas of sectors are proportional to frequencies
Table - 2 Distribution of newly detected leprosy patients by Type, Govt. Leprosy Treatment & Study Centre, Arakandanallur, 1955-57
Fig 2 Distribution of newly detected leprosy patients by Type, Govt. Leprosy Treatment & Study Centre, Arakandanallur, 1955-57 nie
HISTOGRAM • Essentially a bar diagram • Bars are drawn continuously • Width - usually equal • Area - proportional to frequencies
Table 3 Frequency distribution of Haemoglobin levels of adult male patients (n=30)
Fig. 3 Frequency distribution of Haemoglobin levels of adult male patients (n=30)
LINE DIAGRAM • Diagram is drawn by taking • X – axis - time (e.g., Years) • Y – axis - value of any index or quantity • (e.g., couple protection rate) • Displays how a variable has changed over time
Table 4 Number of smear- positive new leprosy cases registered at the Acworth Municipal Leprosy Hospital, Mumbai, 1985-1995 Source: Juwatkar PS, Chulawala RC, Naik SS.Correspondence Indian J Lepr 1997;62 (2):197
Fig 4 Number of smear- positive new leprosy cases registered at the Acworth Municipal Leprosy Hospital, Mumbai, 1985-1995 No. of cases nie
Scatter graph Total Cholesterol vs LDL Cholesterol
Scatter graph Total Cholesterol vs HDL Cholesterol
The Distribution of Data(Rule of Thumb) • The statistical & clinical applications of the term “normal” are often confused and vague • SD> ½ mean --------> Skewed / Non-normal data • Note : Applicable only for variable where negative values are impossible • Ref : Altman BMJ 1991
Same distribution on Normal “Q-Q” Plot Assessing Departures from Normality Approximately Normal histogram Normal distributions adhere to diagonal line on Q-Q plot
Negative Skew Negative skew shows upward curve on Q-Q plot
Positive Skew Positive skew shows downward curve on Q-Q plot
Same data as prior slide with logarithmic transformation The log transform Normalize the skew
Data may have a positive skew (long tail to the right, or a negative skew (long tail to the left). Skewed Data