Download
1 / 24
270 likes | 589 Vues
Incoming Solar Radiation at Top of the Atmosphere Measurements and Modeling. Ehrhard Raschke University of Hamburg, Germany drraschke@aol.com (Based on an assessment report to the GEWEX-RP, Seminar at LASP (13 March 2008) ).

E N D
Incoming Solar Radiation at Top of the Atmosphere Measurements and Modeling Ehrhard Raschke University of Hamburg, Germany drraschke@aol.com (Based on an assessment report to the GEWEX-RP, Seminar at LASP (13 March 2008))
1991 - 1995 Planetary Albedo:31, 31, 30 % surface albedo 13, 15,15% Surface temperature 15.2, 14, 14 K
Measurements from the Earth’s surface French IPY Expedition to Tierra del Fuego (1883) 2.02 ly min-1 (1409 Wm-2) Smithsonian Institution mean for 1900-1950 1.96 ly min-1 (1367 Wm-2) Johnson (1954) 2.00 ly min-1 (1395 Wm-2) Various older textbooks (e.g.: Foitzik and Hinzpeter, 1958: Table 7.1 on page 173, and Table 7.4 on page 185) list earlier values determined e.g. by Angström (1890; 2017 Wm-2), Langley (1884: 2051 Wm-2) and Pouillet (1837; 1230 Wm-2). Measurements from Aircraft, Rockets, Satellites, or High Altitude Balloons Drummond et al. (1967) 1375 Wm-2 Murcray et al. (1969) 1364 Wm-2 Willson (1973) 1368 Wm-2 Thekaekara (1976) 1353 Wm-2 Kondratyev and Nikolskii (1980) 1373 Wm-2Neckel and Labs (1981) 1368-1377 Wm-2 Willson et al. (1981) 1368 Wm-2 AB1 and WR1 during 1980 (Fröhlich, 2000) 1368 Wm-2 Hickey et al. (1982) 1373 Wm-2 Fröhlich (1983) 1367 Wm-2 Crommelynck et al. (1986) 1361.5 Wm-2 SMM (1978-1993) 1367.4 Wm-2Fröhlich and Lean (1998) 1366.5 Wm-2ERBS during1984-2000 (Fröhlich, 2006) 1365.3 Wm-2 SORCE 1361.5 Wm-2
Long-term records of sunspots and cosmogenic isotopes, both indicators of solar activity, allow historical reconstructions of solar irradiances linked to the more recent spacecraft measurements. Cosmogenic isotopes in tree-rings (14C) and ice-cores (10Be) and the group sunspot number are proxies for the long-term variability of solar activity. (Fröhlich and Lean, 2002)
This composite shows the 30-year space-borne record of TSI measurements adjusted to the values from the newest TSI instrument, the SORCE/TIM.
How active will solar cycle 24 be? • 40% higher than cycle 23 • (Dikpati et al, 2005) • - less active than cycle 23 From Lean, 2008; talk given at AAAS
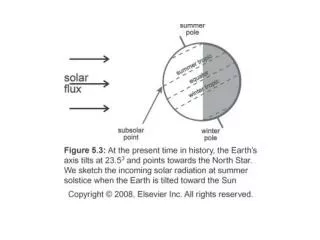
Can we correctly compute the incoming solar radiation at a spherical shell at about 50 km distance from the Earth’s surface, the “top of the atmosphere” ?
Has the basic astronomy been correctly applied ? see: www.google.com
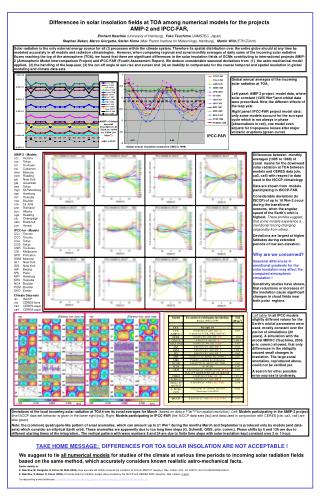
Astronomical data used in IPCC-4AR modeling And by A. Berger and in ISCCP
observed Annual insolation in IPCC-4AR and in AMIP-2 models
ISCCP minus SRB: monthly global averages of insolation at TOA in two climate data sets
Monthly averages of the differences to ISCCP values of zonal averages of the daily insolation as computed for the SRB climatology (thinner lines) and the CERES climatology (thicker lines), respectively. Note these differences are proportional to the radial velocity of the Earth’s orbit. Curves for the years 2001, 2002 and 2003 are in red, green and blue, respectively.
Monthly zonal anomalies to ISCCP parameters, vernal equinox = 21th March - green: 360 days-Gregorian calendar; orange:Gregorian but vernal equinox on 20 March. Model name: MIROC (CCSR/NIES/FRCGC GCM), resolution ~ 250 km
Experiments with ECHAM-5: seasonal variation of SST and sea ice prescribed; simulation time = 22 years Longer day Shorter day Dec. Control run Jan.
Zonal seasonal averages - Differences to control run (averaged over 20 years) Longer day Shorter day N S MAM DJF DJF MAM JJA SON JJA SON
Air temperature near surface– differences (in K) to control run, averaged over 20 years at longer (left) and at shorter (right)) insolation at TOA
Anomalies of air temperature at 2m, and of sea level pressure and of Sea level pressure Air temperature at 2m surface albedo and geo-potential height (300 hPa), all for higher insolation Geo-potential height (300 hPa) Surface albedo
Anomalies of specific humidity (average over 20 years) Longer day Shorter day Control run
Conclusions and future: • Modelers and data analysists should use the same (quality-controlled) routine and astronomical input data to compute the insolation at the top of the atmosphere. Some groups already agreed. • The sensitivity studies should be enhanced to obtain better knowledge of the magnitude of uncertainties due to different insolation routines. • Another sensitivity study with a shallow ocean coupled to the atmosphere is underway and has as yet not shown significant systematic differences.
We still need to learn more about data uncertainties and how to avoid them ! Many Thanks