Download
1 / 5
50 likes | 135 Vues
The document provides insights on using the Tarde4Bulls trading platform efficiently. It includes detailed sections on market trends, trade advisors, trend analysis, stop loss strategies, and chart components to guide profitable trading decisions.

E N D
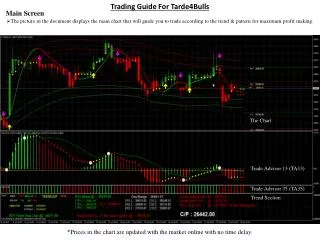
Trading Guide For Tarde4Bulls • Main Screen • The picture in the document displays the main chart that will guide you to trade according to the trend & pattern for maximum profit making. The Chart Trade Advisor 13 (TA13) Trade Advisor 35 (TA35) Trend Section *Prices in the chart are updated with the market online with no time delay.
Main Screen is divided into four main sections; they are as follows from bottom to top, with their description: • Trend Section: Trend Section is divided into different parts showing market trends • Overall Trend Direction: • Per hour resistance and support: • Day price range resistance and support: • Per hour trade price range: • Minor and Major Stop Loss as per current trend: • Current Price
Main Screen (Continues) • 2. Trade Advisor 35 (TA35): This trade advisor indicates the trading support for buying & selling: If the spikes are RED then it shows strong selling support means one can go for a sell trade. If the spikes are GREEN then it shows strong buying support means one can go for a buy trade.
Main Screen (Continues) • 3. Trade Advisor 13 (TA13): • In concern with the TA35 this Trade Advisor (TA13) also suggest one for buying or selling: • Wide GREEN Spikes suggest for strong buying support trend with GREENSpikes in TA 35. • Narrow GREENSpikes suggest for weak buying support trend , although TA35 shows a GREENSpike corresponds to TA13 GREEN Spike. • Wide RED Spikes suggests for strong selling support trend with the RED Spikes in TA35. • Narrow RED Spikes suggest for a weak selling support trend , although TA35 shows a RED Spike corresponds to TA13 RED spike. • Dots indication: • RED Dot : This is an indicator for SELL. • YELLOW Dot: This is an indicator for BUY. • WHITE Dot: Major market trend change. • If RED dot appears below RED line then this indicates that the market is in strong SELL. • If YELLOW dot appears above GREEN line then this indicates that the market is in strong BUY. • IF dots are in between GREEN & RED Lines then the market is trendy or unpredictable or volatile or sideways. This situation is not suitable for LONG duration trades but may give some profit with SHORT duration market in and out.
Main Screen (Continues) • 4. Main Chart: • Components of Main Chart: • Two Parallel RED lines : Selling or Over Bought Zone. • Two Parallel GREEN lines : Buying or Over Sold Zone. • Trend Line: • If RED : BUY Trend • If GREEN : SELL Trend • Arrow: • PURPLE Arrow : For SELL * • YELLOWArrow : For BUY * • * Trade at opening of next candle or bar • Candle Color: • RED Candle : SELL Trend • GREEN Candle : BUY Trend • Level For The Day: • GREEN • H4 : Price above this strong BUY. • RED • H3 : Prices may come down from this level. • PURPLE • Pivot Point : If market opens above this level then it seems Bullish and if market opens below this level then it seems Bearish. • GREEN • L3 : Prices may go up from this level • RED • L4: Price below this strong SELL.