AATSR SST Validation using the M-AERI
AATSR SST Validation using the M-AERI. Peter J. Minnett Rosenstiel School of Marine and Atmospheric Science, University of Miami, Florida, USA Marianne Edwards Space Research Centre, University of Leicester Leicester, UK. ENVISAT Validation Workshop Frascati 12 December 2002.

AATSR SST Validation using the M-AERI
E N D
Presentation Transcript
AATSR SST Validation using the M-AERI Peter J. Minnett Rosenstiel School of Marine and Atmospheric Science, University of Miami, Florida, USA Marianne Edwards Space Research Centre, University of Leicester Leicester, UK ENVISAT Validation Workshop Frascati 12 December 2002
Overview • SST variability • The M-AERI • Validation cruises • Past experience • Future directions
M-AERI data for satellite SST validation • Skin SST is source of signal detected by infrared satellite radiometers. • Use of M-AERI for validation is comparing “like with like.” • For example, satellite SST accuracy determined with buoy data includes near surface SST variability, which can be significant during the day.
Near surface temperature gradients – reality Profile measured at 12:51 local time on 4 October 1999. Off Baja California, R/V Melville MOCE-5 cruise. Blue line = SkinDeEP* profile Blue circle = M-AERI skin temp. Red cross = Float bulk SST at ~0.05m Green star = Ship thermosalinograph at ~3m From Ward, B. and P. J. Minnett, 2001. An autonomous profiler for near surface temperature measurements. Gas Transfer at Water Surfaces. M. A. Donelan, W.M. Drennan, E.S. Saltzmann and R. Wanninkhof (Eds.) American Geophysical Union Monograph 127. 167 - 172.
Time evolution of near-surface thermal gradients SkinDeEP profiles on 12 October 1999.Off Baja California, R/V Melville. From Ward, B. and P. J. Minnett, 2001. An autonomous profiler for near surface temperature measurements. Gas Transfer at Water Surfaces. M. A. Donelan, W.M. Drennan, E.S. Saltzmann and R. Wanninkhof (Eds.) American Geophysical Union Monograph 127. 167 - 172.
M-AERI spectra Air Temperature Skin SST Both temperatures measured by one instrument, one calibration. From Minnett, P. J., R. O. Knuteson, F. A. Best, B. J. Osborne, J. A. Hanafin and O. B. Brown (2001). "The Marine-Atmospheric Emitted Radiance Interferometer (M-AERI), a high-accuracy, sea-going infrared spectroradiometer." Journal of Atmospheric and Oceanic Technology. 18(6): 994-1013.
Temperatures are traced to NIST • On-board black-body cavities have thermometers calibrated to NIST-traceable thermometers (SSEC) • Periodic calibration using a 3rd black body in M-AERI zenith view. • Periodic calibration of M-AERI system with a NIST-designed Water-Bath Black-Body target at RSMAS, using NIST-traceable reference thermometers. • RSMAS Water-Bath Black-Body target characterized with NIST EOS TXR NIST EOS TXR TXR characterizing the RSMAS WBBB
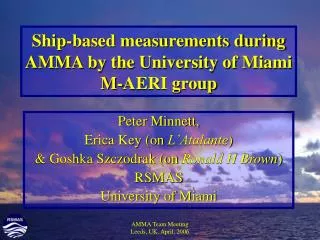
M-AERI in the Mediterranean One of a series of cruises in collaboration with CNR Institute of Atmospheric Physics and Climate, Rome.
Time-series of M-AERI measurements on Explorer of the Seas The Explorer of the Seas is a Royal Caribbean Cruise Liner, operating a bi-weekly schedule out of Miami. It is outfitted as an oceanographic and atmospheric research vessel, very suitable for satellite validation. For more details see http://www.rsmas.miami.edu/rccl/
Comparison of M-AERI with AATSR Explorer of the Seas cruise track • Over 140 M-AERI files (days) between May and September converted and uploaded to the NILU database.
Past M-AERI results…. • AVHRR Pathfinder • MODIS
Cruise Name N Mean K St. Dev. K CSP 1996 23 0.16 0.20 24N 1998 16 0.03 0.18 GASEX 1998 168 -0.01 0.25 FPO 1998 47 0.27 0.40 NOW 1998 (Arctic) 176 0.24 0.44 Total, all data 430 0.13 0.37 Total, excluding NOW data 254 0.06 0.29 AVHRR-MAERI SST validation experience M-AERI validation of Pathfinder SSTs Using skin temperatures reduces the uncertainties by about a factor of two. See Kearns et al, 2000, Bull. Am. Met. Soc., 81, 1525-1536 254 0.06 0.29
MODIS SST Buoy and MAERI retrieval StatisticsVersion 4.5 (new delivery)BUOY M-AERI • SST - new coefficients Median StdDev Number of Points • Terraall -0.07 0.48 11027 • Terra night 0.01 0.42 4387 • Terra day -0.14 0.51 6643 • Aqua all 0.05 0.48 3821 • Aqua night 0.00 0.43 1628 • Aqua day 0.09 0.51 2203 • SST4 new coeffs, new formulation • Terranight 0.00 0.41 1319 • Aquanight -0.01 0.39 4096 • SST - new coefficients • Median StdDev Number • of Points • Terra all • Terra night 0.00 0.38 345 • Terra day • Aqua all • Aqua night 0.22 0.37 59 • Aqua day • SST4 new coeffs, new formulation • Terranight 0.02 0.34 278 • Aquanight -0.04 0.39 48
Terra MODIS SST ValidationBoth SST and SST4 products show no trends with time (Jan 01-Sept 02), satellite zenith angle (not shown) or latitude vs drifting buoys. Dotted lines are ± 0.2K and enclose 50% of the retrievals Thermal, 10-11 µm SST SST residual vs time by latband Mid-wave, 4 µm SST SST4 residual vs time by latband
Issues • Accuracy of M-AERI data well established. • M-AERI data-flow to Leicester, and to NILU, established. • Narrow swath of AATSR is going to be a handicap in developing a large M-AERI – AATSR validation data base (clouds cause ~90% data loss). • Much larger numbers of buoys are an attractive proposition, especially at night, and can complement radiometer measurements. • Inter-satellite comparisons should be made, e.g. AATSR and MODIS; EOS Terra is in a compatible orbit (overpass time).
Night-time behavior of the skin effect From Donlon, C. J., P. J. Minnett, C. Gentemann, T. J. Nightingale, I. J. Barton, B. Ward and J. Murray (2002). "Towards improved validation of satellite sea surface skin temperature measurements for climate research." J. Climate15: 353-369. T = -0.14 – 0.3 * exp(-U/3.7)
Terra/Aqua Global DAY SST - Sept 29, 2002 Aqua-day Terra-day Aqua-day
Wind speed dependence of diurnal & skin effects Envisat, Terra and Aqua overpass times. Note, local time varies across the swath.
Future plans • Validate AATSR SSTs • 2003 cruises: • Explorer of the Seas (2 weeks dry dock in January, 2003) • Polar Sea: Melbourne – Yokohama – Seattle, March – April • Urania: Mediterranean, April-May • Franklin: Canadian Arctic, September 2003, for 12 months (?) • Tangaroa: November, NZ SOLAS (?) • Polar Star: Seattle – Sydney, November -December • AVHRR, MODIS, AIRS, AMSR SSTs