Download
1 / 10
100 likes | 287 Vues
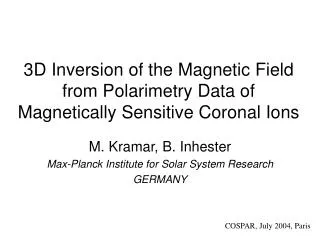
“ Coronal Magnetograms of Solar Active Regions Derived from Polarization Inversion in Microwaves”. Boris Ryabov Latvian University, Latvia. MSFC Photospheric Magnetogram of NOAA 7260. NoRH Coronal Magnetogram of NOAA 7260.

E N D
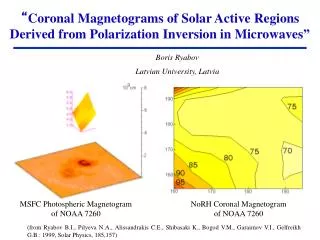
“Coronal Magnetograms of Solar Active Regions Derived from Polarization Inversion in Microwaves” Boris Ryabov Latvian University, Latvia MSFC Photospheric Magnetogram of NOAA 7260 NoRH Coronal Magnetogram of NOAA 7260 (from Ryabov B.I., Pilyeva N.A., Alissandrakis C.E., Shibasaki K., Bogod V.M., Garaimov V.I., Gelfreikh G.B.: 1999, Solar Physics, 185,157)
Time dependence of polarization inversion fits the model properties of QT-region. NOAA 9068 Model prediction of QT-region QTR NoRH maps & KPNO magnetograms
Technique of coronal magnetography. NOAA 9068 B(G) 205.4/3(cm) [- ln(0.5 o+ 0.5)] /1/3, where the product of electron density N and the scale Ld of coronal magnetic field divergence is assumed to be constant, NLd = 1018 cm-2, is observing wavelength. = 5.2 cm (from Bezrukov D.A., Ryabov B.I., Bogod V.M., Gelfreikh G.B., Maksimov V.P. , Drago F. , Lubyshev B.I. , Peterova N.G., Borisevich T.P.: 2004, to be published in Baltic Astronomy)
Frequency dependence of polarization inversion fits the QT - propagation. NOAA 8365 NoRH maps V/I observed at 1.76cmon (a) October 22, (b) 23, (c) 24, 1998 - DL is found to be closer to the NL at a shorter wavelength, as DL is formed at stronger coronal magnetic fields for a shorter wavelength. - The closer an AR to the solar limb is the shorter is the wavelength required to detect the polarization inversion. SSRT maps V/I observed at 5.2 cm on (d) October 21, (e) 22, (f) 23, 1998
Coronal magnetography is a 3D magnetography. NOAA 8365 (1) As the shape and the height of any QT-surface are not known in radio observations revealing the strengths of coronal magnetic fields, they should be evaluated from 3D model simulations. (2)To provide credible coronal magnetograms the lo-cation and the directivity V(q) of the microwave source should be made clear by 3D model simulations. The coronal magnetograms measured in the plane of view should be restored in 3D space.
Model evaluation of coronal heights for 2-D magnetograms. NOAA 8365 FFF Model Simulations: m.f. & height The coronal magnetograms in the range of 10 30 G at 5.2 cm (SSRT) and 50 110 G at 1.76 cm (NoRH)are evaluated. The height of the QT-region is estimated from the force-free field extrapolations as 6.2 109 cm for the 20 G and 2.3 109 cm for 85 G levels. SSRT: coronal magnetograms (from Ryabov B.I., Maksimov V.P., Lesovoi S.V., Shibasaki K., Nindos A., Pevtsov A.: 2004, to be published in Solar Physics)
Consistency of results. Radio observations of the active region NOAA 8365 The features of the measured coronal magnetograms: • DL tends to move toward the western solar limb; • DL is found to be closer to the NL at a shorter wavelength; • the gradient is in the W-E direction for a bipolar AR located in the western hemisphere. The measured values (28 150 G from the NoRH maps at 1.76 cm and 6.7 35 G from the SSRT maps at 5.2 cm) overlap and can be compared. NoRH and SSRT: coronal magnetograms of October 23, 1998
Difficulties of coronal magnetography: NOAA 9415 • Not all mechanisms of polarization inversion in the microwave range have been investigated. This coronal magnetography should be conducted with a caution to avoid the confusion of QT and non QT-propagations. • The technique needs further improvements concerning the evaluation of the coronal height, directivity, and the evolution of a microwave source. NoRH observations on April 12-13, 2001. A sketch of polarization changes produced by 2 coronal regions of QT-propagation and observed with the RATAN-600 (from Bogod V.M., Gelfreikh G.B., Drago F.Ch., Maksimov V.P., Nindos A., Kaltman T.I., Ryabov B.I., Tokhchukova S.Kh.: 2003, ASTROPAGE, astro-ph/03009444).
Oscillations Depolarization line oscillations show evidence of the oscillations of QT-region and/or the oscillations of iso-gauss surface (1) Stable coronal magnetogram results from radio maps averaged over 30 – 60 minute time intervals (NoRH). Alternative ways to get results (2) The coronal magnetic field oscillations with the charac-teristic time of 10 – 20 minutes have been reported (SSRT). (from Gelfreikh G.B., Ryabov B.I., Agalakov B.V. , Borisevich T.P., Peterova N.G.: 2004, submitted to Baltic Astronomy)
Summary • Microwave measurements have the potential to determine magnetic fields in solar active regions in the range of 10 – 110 G taking advantage of radio mapping with the NoRH and the SSRT. • Existing interpretations of possible polarization inversions in microwaves have to be supplemented with new ones in an effort to discriminate the polarization inversions due to QT-propagation. • Obtaining the values of the QT-region heights makes the coronal magnetography three-dimensional. • An advance in this coronal magnetography application is ex-pected to be in the field of coronal field oscillations (the intensities of coronal fields and their spatial and temporal variations).