Food Security Analysis Unit (FSAU) - Somalia
150 likes | 372 Vues
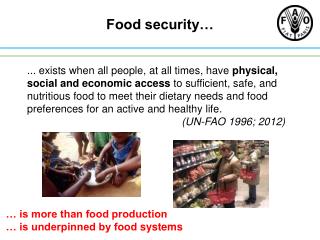
Food Security Analysis Unit (FSAU) - Somalia. Monthly Food Security & Nutrition Brief SSS FSRD Meeting April 9, 2008 Nairobi, Kenya. EUROPEAN COMMISSION. Emergency Food Security and Nutrition Update. Updated Somalia IPC Map and Population Numbers

Food Security Analysis Unit (FSAU) - Somalia
E N D
Presentation Transcript
Food Security Analysis Unit (FSAU) - Somalia Monthly Food Security & Nutrition Brief SSS FSRD Meeting April 9, 2008 Nairobi, Kenya EUROPEAN COMMISSION
Updated Somalia IPC Map and Population Numbers Rapidly Deteriorating Situation in South & Central Somalia • Main Contributing Factors: • Extremely Harsh ‘Jilaal’ Dry Season – Throughout Somalia • Abnormally high temperatures • Unusual dry hot winds • High evaporation of surface water • Accelerated deterioration of pasture and browse • Increased Open Conflict and Insecurity – Throughout South and Central • Increased number and location of ‘Insecurity Epicenters’ • Increasing population displacement (Mogadishu, Hiran) • Further Trade and Economic Disruptions, Decreased Access • Continuing High Rates of Inflation in Last Three Months • March ‘08 cereal prices are 215% to 475% of March ‘07 • Abnormally high increases (up to 80% ) between Jan. – March ’08 • IMPACT: Severity differs depending on pre-season conditions • MOST SEVERLY IMPACTED: Central regions, Hiran, Bakool, Coastal Shabelle, Pockets in Sool, Nugal and Hawd regions in the Northern regions
Climate Extremely Harsh ‘Jilaal’ Dry Season – Throughout Somalia Figure 1: Rainfall Anomalies (mm) March 1–April 2, 2008 Poor cattle body condition in Jalalaqsi/Hiran. Huge fodder sales in Beletweyn, Hiran region, copping mechanism for riverine.
CIVIL INSECURITY • Increased number and location of ‘Insecurity Epicenters’ - Throughout South Central
MarketsContinuing High Rates of Inflation in Last Three Months Central Region Cereal Prices (SoSh)
MarketsContinuing High Rates of Inflation in Last Three Months Hiran Region (Belet Weyne) Cereal Prices (SSh)
MarketsContinuing High Rates of Inflation in Last Three Months Shabelle Valley Cereal Prices (SoSh)
Between Feb 16- Mar 9, 2008, 477 cases of AWD were reported from Beletweyn including 4 related deaths (CFR=0.84%). Overall, 49% of the cases (234/477) were reported from the MSF-CH hospital, 31% from Kooshin East IMC MCH, 10% from Buunda Weyne IMC MCH and 10% from Buunda Weyne SRCS MCH/OPD. 88% of the cases were children aged <five years Distribution of AWD cases, Beletweyn District Feb16 – Mar 8, 2008 Acute Watery Diarrhea (AWD) – WHO Somalia, Mar 12’08, bulletin Nutrition Acute Water Diarrhea Outbreak – Hiran Region
Updated Somalia IPC Map (April ‘08) January to June 2008 Comparison of January ‘08 and Revised April ’08 IPC Map Map 1: Post Deyr ’07/08 Projection, January Through June ’08, (Jan. ’08) Map 2: Updated Post Deyr ’07/08 Projection, January Through June ‘08, (April ’08)
Updated Somalia IPC Table (April ‘08) Populations in AFLC & HE, January – June ‘08, Revised April ‘08
Updated Somalia IPC Map (April ‘08) January to June 2008 Overall Summary • Deterioration in Severity of Crisis: From AFLC to HE (Central, Bakool and Hiran Regions) • Increased Levels of Warning: Moderate Risks to Further Deterioration inShabelle Regions, Northern Parts of Hawd, Sool and Nugal Regions and High Risk in Hiran and Bakool Regions • Total Number of Food Insecure is Increasing • Increased in number in HE from 315,000 to 425,000 • Increased total number in HE and AFLC from 850,000 to 910,00 • Increased number of IDPs from 705,000 to 745,000 • Increase in TOTAL POPULATION in Crisis: 1.83 to 1.93 million • Missing Estimates for Populations in Crisis: • Number of newly displaced people from Belet Weyne (Hiran) • Number of Urban poor in AFLC or HE • NOTE: FSAU Rapid Emergency Urban Assessment in selected main urban centers and settlements is ongoing throughout Somalia
Updated Somalia IPC Map (April ‘08) January to June 2008 Overall Summary • Risk Factors: • Gu Seasonal Rains (start mid-April to June) • Inflation – Cereal, Essential Staple & Non-Staple Commodities, Fuel • Civil Insecurity and Conflict • Implications: Contingency Planning for Increased Needs for Livelihood & Humanitarian Response: • Central Regions – Significant increase in needs of rural AFLC & HE, Urban food insecure, IDPS and Host Communities • Hiran Region – Significant increase in needs of rural AFLC & HE, Urban food insecure, IDPS and Host Communities • Bakool Region – Significant increase in needs of rural AFLC & HE, Urban food insecure • Shabelle Region - Increase in needs of rural AFLC & HE, Urban food insecure, IDPS and Host Communities • Northern Gedo - Increase in needs of rural AFLC & HE and Urban food insecure • North Parts of Hawd, Sool, Nugal Livelihood Zones – New livelihood support needs for rural in AFLC • Poor Food Insecure Urban Populations - New livelihood support needs for rural in AFLC
Children sleep under a mosquito net, which unfortunately is perforated, FSAU Huddur’07 Nutrition Malaria prevalence • 25 studies on malaria prevalence (P. falciparum) were conducted in Somalia in 2007, using RDT. • The studies were conducted concurrently with the FSAU led nutrition surveys, with support from the Global Fund. Data collected has also been in the Global Malaria mapping project. • The highest prevalence was recorded in pastoral (20.8%) and the lowest in riverine zones (4%). • The overall reported use of nets in the night prior to the survey was 14.4%, though it was higher in the riverine zone (21.4%). • Overall infection prevalence was lower in net users (8.1%) compared to non-net users 16.6% - however some nets are in poor condition and require replacement (See photo) • Additional studies planned for 2008