RESEARCH METHODOLOGY
RESEARCH METHODOLOGY. SURVEY ON LAPTOP. What is RM. Detail study is required in each practical problem Any effort which is directed to such study for better results is a “Research”

RESEARCH METHODOLOGY
E N D
Presentation Transcript
RESEARCH METHODOLOGY SURVEY ON LAPTOP
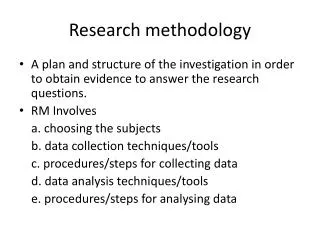
What is RM • Detail study is required in each practical problem • Any effort which is directed to such study for better results is a “Research” • Asystem of models, procedures and techniques used to find out the results of a research problem is called as “Research Methodology”
Why RM is required • Business Executives in each of the functional areas face decision making problems. • Many of these problems demand systematic research. • Some problems are – New product launch, Sales promotion, Plant layout, plant location, capital budgeting, manpower planning etc.
Research Process Problem Definition Research Design Data Collection Objective Data Analysis Validation Results
Types of Research Exploratory Research Conclusive Research Modelling Research Algorithmic Research Literature Survey Descriptive Research Experience Survey Experimental Research Study of Insight Examples
Research Methodology • Methodology is very important as it acts as guiding posts to the study and at the same time eliminates wasteful expenditure of time and inquiry in the study • Data Collection METHODS : PRIMARY DATA • First hand data • Interviews • Surveys / Questionnaires • DATA COLLECTION: SECONDARY DATA • Secondary data is the data that has already been collected by someone else for a different purpose to yours. • Paper based sources • Electronic sources
Research Objectives • Physical proximity is the main driver for purchase of laptops • Preference for laptops over desktop is for factors beyond economical viability
THE TARGET GROUP FOR RESEARCH Main Target Laptop users mainly students of age group 18-25 Secondary Target Executives
Information areas to capture • Quantitative evaluation of a laptop users • Consumer profile. • Demographic attributes like age, sex, occupation, lifestyle.
2. Consumer purchase habits vis-à-vis laptops • Place of purchase • Purchaser and decision maker • Influencer • Purchase cycle • Price
Information areas to capture Contd…… • 3. Consumer usage habits. • i. Brands aware • 4. Category triggers and barriers. • i. Triggers to laptop usage • ii. Barriers to desktop usage
LAPTOP INDUSTRY IN INDIA • The laptop computer market in India grew by 84.8% • Largest contributors were enterprise and education segments. • Portability,' number one' driver for growth said. • Portability, flexibility and ease of use and narrowing of price-performance.
Research Objective • To Analyze the brand preference • Overall satisfaction • Price factor • Influential factors for purchase
1)Test of Hypothesis • H0: No significant difference between satisfaction level in various brands • H1: There is a significant difference between satisfaction level in various brands.
Calculation • χ2 = Σ ( Oij- Eij )2 / Eij = 3.494 • Degree of freedom = ( r -1)( c-1) = ( 2-1)(5-1)= 4 • Assume level of significance at 5 % • χ2 = 9.49 – Table Value • χ2calculated < χ2 tabulated
Accept the null hypothesis i.e. No significant difference between satisfaction level in various brands
2) Test of Hypothesis • Do people consider price factor as major factor during purchasing laptop. • H0:Price is not considered during purchasing laptop • H1: Price is considered during purchasing laptop
Calculation • χ2 = Σ ( Oij- Eij )2 / Eij = 9.89 • Degree of freedom = ( r -1)( c-1) = ( 2-1)(5-1)= 4 • Assume level of significance at 5 % • χ2 = 9.49 – Table Value • χ2calculated >χ2 tabulated
Reject the null hypothesis i.e. Price is considered during purchasing laptop.
Limitations • Geographical Diversity • Sample size
Conclusion Most of the people buy laptop for education purpose Brand preference DELL Price matter while purchasing People are satisfied with laptop
Bibliography Research Methodology by Paneer Salvam www.google.com