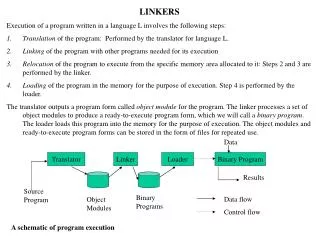
Step-by-Step Guide to Problem Solving in Programming
This guide outlines the essential steps involved in solving programming problems, from understanding the problem to testing the final solution. By utilizing algorithms, flowcharts, and pseudocode, learners will be able to systematically approach and solve challenges such as adding two numbers, calculating averages, and determining pass/fail grades. The emphasis on clear representation of logic through flowcharts and pseudocode facilitates better understanding and execution of programming tasks, enabling learners in the IT field to develop essential problem-solving skills.


Step-by-Step Guide to Problem Solving in Programming
E N D
Presentation Transcript
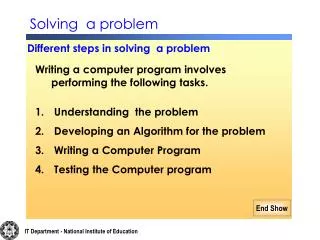
Solving a problem Different steps in solving a problem • Writing a computer program involves performing the following tasks. • Understanding the problem • Developing an Algorithm for the problem • Writing a Computer Program • Testing the Computer program IT Department - National Institute of Education
Lets take a problem and try to solve the problem Problem : Add two numbers and display total. IT Department - National Institute of Education
STEP 1 – Understand the problem How do you solve that problem ? The first task is to understand the problem clearly Find out the inputs ? Here the input should be two numbers. IT Department - National Institute of Education
Find outputs ? Total. So there must be some calculation to get the total. That is Process. IT Department - National Institute of Education
STEP 2 – Developing an Algorithm for the problem The method that used to solve the problem is called algorithm Algorithm can be represented in two ways 1.Graphically 2. Textually IT Department - National Institute of Education
A Graphical representation of making a cup of tea Start Boilwater Put tea powder to mug Add some sugar Serve This Representation is called as Flow Chart Stop End Show IT Department - National Institute of Education
Flowchart A graphical representation of the sequence of operations in a program is called Flow Chart. flowchart shows how data flows and operates IT Department - National Institute of Education
Symbols used in Flow chart Process Start/Stop Decision Yes No Input/Output Flow line IT Department - National Institute of Education
A Graphical representation to add two numbers Start Input two numbers Calculate total Display total Stop This Representation is called as Flow Chart End Show IT Department - National Institute of Education
Stop Start Input Age Adult child Draw a flow chart to find adult or child. Yes No Ifage>=18 IT Department - National Institute of Education
Start Stop Draw a flow chart to cross the road. Go to pavement Look at left & right Yes No Are clear both ways? Cross the road Wait IT Department - National Institute of Education
Draw a flow chart to find the correct key from a bunch keys to open the door. Start Tryout a key Can the door be opened Yes No Try the next key Stop IT Department - National Institute of Education
Problem Solving 1 Input name, Maths and Science marks and calculate Total. Display Name & Total Marks . Solve & design the above problem in Flow chart. IT Department - National Institute of Education
Conti.. Start Input Name, Maths Mks , Science Mks Total= Maths + Science Display Name,Total Stop End Show IT Department - National Institute of Education
Problem Solving 2 Draw Flow chat to input Average Marks and display Pass or fail (If Average>= 60 , “Pass” otherwise “Fail”) IT Department - National Institute of Education
Start InputAverage IfAvg>=60 No Yes FAIL PASS Display Grade Stop IT Department - National Institute of Education
Problem Solving 3 Draw a flow chart to input Average Marks and find the grade according to the grade System given below. 75 - 100 “A” 65 - 74 “B” 55 - 64 “C” 45 - 54 “S” 0 - 44 “F” IT Department - National Institute of Education
Input Avg Stop Start Yes If Avg>=75 Display A No Yes Display B If Avg>=65 No Yes If Avg>=55 Display C No Yes Display S If Avg>=45 No Display F IT Department - National Institute of Education
Draw a flow chart to print numbers from1 to 10 Start Number=1 No Is Number < =10 Number=Number+1 Yes Print Number Stop IT Department - National Institute of Education
Pseudo Code One of the textual representation of algorithm is Pseudo code. IT Department - National Institute of Education
Pseudo Code for adding two numbers Begin Input first number and second number Total = first Number + Second Number output Total End. IT Department - National Institute of Education
Write a pseudo code to take maths and science marks , calculate total, average and display grade. (If average >=60, “Pass” otherwise “Fail”. Begin Input Maths Marks ,Science Marks Total = Maths + Science Average = Total / 2 If Average >= 60 then Grade= “PASS” Else Grade= “FAIL” End if Display Total , Average , Grade End IT Department - National Institute of Education
Write a pseudo code to input Average Marks and find the grade according to the grade System given below. 75 - 100 “A” 65 - 74 “B” 55 - 64 “C” 45 - 54 “S” 0 - 44 “F” IT Department - National Institute of Education
Begin Input Avg Mks If Avg >=75 then Grade = “A” Else If Avg >=65 then Grade =“ B” Else If Avg >=55 then Grade = “C” Else If Avg >= 45 then Grade =“ S” Else Grade = “W” End if End if End if End if Display Grade End IT Department - National Institute of Education
Write a Pseudo code to display numbers from 1 to 10 Begin Number=1 Do While Number <=10 Print Number Number=Number + 1 End while End IT Department - National Institute of Education