Download
1 / 7
70 likes | 92 Vues
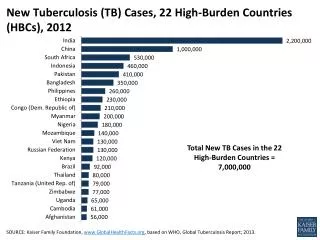
Understand the burden of TB by examining DALYs, YLL, and YLD, and how death contributes to its ranking in global health. Explore historical data on TB cases and deaths, illustrating the improvements in control measures and their impact on mortality rates.

E N D
What is “burden”? • DALY = YLL (death) + YLD (disability) • For TB ~ 90% DALYs due to death • death is why TB is among top 10 in “burden” league table
Decline in TB, Alaska 1950-73 6 cases 13%/yr 5 t = 5 yr 1/2 4 3 Incidence or death rate/10K/year 2 1 0 deaths 30%/yr -1 t = 2.3 yr 1/2 -2 1950 1955 1960 1965 1970 1975 source: Grzybowski Tubercle 1976
Impact of TB control on cases and deaths Netherlands 1950-94 6 5 incidence 7.0%/yr 4 CFR 15% 3 2 1 0 CFR 1.5% -1 deaths 12.3%/yr -2 -3 50 55 60 65 70 75 80 85 90 95 year
TB cases and deathsUruguay, 1945-1995 Cases Deaths GTB, 1997
Trends in TB death registrations 1200 Former Soviet Union Central Europe 1000 Industrialized 800 Latin America Geometric mean number of deaths 600 400 200 0 1985 1990 1995 2000
Impact of improved TB control: deaths reduced in Peru 20000 other defaulted DOTS 1991 15000 untreated Estimated number of deaths 10000 5000 0 87 88 89 90 91 92 93 94 95 96 97 98 99