How did we get here?
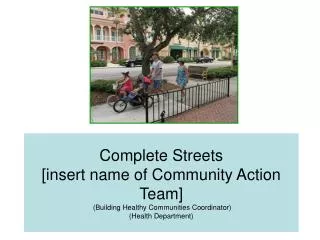
Complete Streets [insert name of Community Action Team] (Building Healthy Communities Coordinator) (Health Department). How did we get here?. The Focus. Complete Streets. Safe Routes to School. . Context Sensitive Solutions. Walkable, Bikeable Communities.

How did we get here?
E N D
Presentation Transcript
Complete Streets[insert name of Community Action Team] (Building Healthy Communities Coordinator)(Health Department)
The Focus Complete Streets Safe Routes to School Context Sensitive Solutions Walkable, Bikeable Communities
What are “Complete Streets”? Complete streets are roadways planned, designed and constructed to accommodate safe access for all users. On these streets, pedestrians, bicyclists, motorists and transit riders of all ages and abilities are able to safely move along and across streets which may include sidewalks, crosswalks, and bike lanes.
Complete Streets & Context Sensitive Solutions Examples Urban Suburban Rural There is no prescription for Complete Streets!
Incomplete Street TOO NARROW TO SHARE WITH BIKES
Incomplete Street TOO DANGEROUS TO CROSS ON FOOT
Incomplete Street UNINVITING FOR BUS RIDERS
Incomplete Street INACCESSIBLE FOR WHEELCHAIR USERS
Incomplete Street NO ROOM FOR PEOPLE, NO SIDEWALKS
Top Pedestrian Complaints:Incomplete Streets 2002 National Transportation Availability & Use Survey
Top Bicyclist Complaints:Incomplete Streets 2002 National Transportation Availability & Use Survey
Michigan Pedestrian Safety Deaths in Crashes • 2009 in 121 • 2008 in 114 • 2007 in 134 Source: Michigan Traffic Crash Facts/Office of Highway Safety Planning
How is Lansing doing? Every three days someone is hit while walking or bicycling in Lansing, on average. (Lansing Police Department Traffic Crash Reporting System Data) In Lansing, 2.45% of trips are by foot and 0.42% bike. In Ann Arbor, 15.79% of trips are by foot; in Madison 3.19% of trips are by bike. (U.S. Census Decennial, 2000)
Locations of 653 walking and bicycling accidents in Lansing 2001-2005 • Corridors/ major streets seem to have more accidents: • MLK • Cedar • Along 496 • Michigan Ave • Saginaw • Oakland • Mt. Hope • Jolly • Miller
Age Distribution of Victims Lots of accidents among people age 11-25 and age 42-51. Some, but fewer, for ages 5-10 and 26-41.
Did You Know? In the 2000 U.S. Census, 8,713 Ingham County households did not have a vehicle. Lansing residents include: • 11,132 seniors over age 65 • 9,594 people with two or more disabilities • 20,657 children between age 5 and 16* This is nearly 40% of our total population!
Why Complete Streets? MONEY Ease Residents’ Expenses • Non-motorized travel allows people to make fewer car trips and save on gasoline. • A 2007 MSU study confirms that building walk and bike friendly features leads to more walking and bicycling. Ease Employers’ Expenses • Poor exercise habits of employees costs employers additional healthcare costs. • Businesses that provide opportunities for employees to walk and bicycle during the workday report a ~30% reduction in sick-leave absenteeism, health care use, and worker’s comp and disability claims.
Why Complete Streets? MONEY Ease Government Expenses • Non-motorized travel manages traffic demand, saves money on road and parking facilities, and reduces congestion. • By making a community more walkable, property values can increase from $10-$40/sq.ft. to $50-$100/sq.ft. and homebuyers are willing to pay $20,000 more. Increase Sales for Businesses • Walkability features in downtown Lodi, CA have led to a 30% overall increase in sales for downtown businesses, a drop in the vacancy rate from 18% to 6%, and the addition of 60 new businesses. * Sources at www.walkbikelansing.com/Why
Why Complete Streets? HEALTH Improve Physical Health • The leading cause of death in Michigan is heart disease. • 1/3 of all deaths in the United States attributable to coronary heart disease could have been prevented if all persons were highly active. • Research continues to show a strong relationship between walkability and bikeability and residents’ overall physical health. Ease Healthcare Costs • If just 1 in 20 sedentary Michigan adults became physically active, Michigan employers would save $575 million per year in healthcare costs and insurance premiums.
Why Complete Streets? ENVIRONMENT Improve Air Quality • In Michigan, vehicles create 30% of Michigan’s ozone-forming pollutants. • 2006 studies show that the more walkable a community, the lower the vehicle emissions. Reduce Our Carbon Footprint • Global warming is increasing, and the impacts will only get worse if we don’t start cutting carbon emissions. • Between 1960 and 2001, Michigan’s CO2 emissions from fossil fuels increased by 46%—primarily as a result of oil combustion for transportation.
Why Complete Streets? PEOPLE • Protect Our Children and Older Adults Of the 13 pedestrians and bicyclists killed by cars in Lansing between 2000 and 2006, most were children and seniors. • Attract Residents 79% of Americans rate “sidewalks and places to take walks” as a top consideration in choosing where to live. • Recent college graduates from Michigan schools say that safe streets and neighborhoods, walk-able streets, and affordable living are their top factors in choosing where to live.
Why Complete Streets? PEOPLE • 50% of Americans will be over 55 in 2030 • 21% of Americans over the age of 65 do not drive • 33% of Americans don’t drive • >50% of non-drivers stay at home because they lack transportation options Photos: Michael Ronkin, ODOT
Why Complete Streets? PEOPLE • Walking and bicycling help prevent obesity, diabetes, high blood pressure, and colon cancer. • Residents are 65% more likely to walk in a neighborhood with sidewalks.
Why Complete Streets? PEOPLE • 20% of Americans have a disability that limits their daily activities • Complete Streets feature curb cuts and other designs for disabled travelers • Complete Streets reduce isolation and dependence
Why Complete Streets? PEOPLE • 52% of Americans want to bike more than they do now • 55% of Americans would prefer to drive less and walk more photo: Dan Burden, pedbikeimages.org
How Do We Make Lansing Walk and Bike Friendly? One strategy*: Create a network of walkways and bikeways based on what residents, businesses, and stakeholders want: • Sidewalks – need new • Sidewalks – need repair • Crosswalks – need new • Crosswalks – need modification • Curb Cuts – need one or need improvement • Bike Routes: signed routes on good biking streets • Bike Lanes: 4’-6’ special lane, striped and signed • Trails: off-road, for walking, biking, rollerblading, etc * Note: several other strategies related to education and health promotion have also been outlined in the Walk and Bike Lansing! strategy document.
FHWA Walkway and Bikeway List • Sidewalk—A paved walkway that allows pedestrians to walk along the roadway without interference from traffic. • Buffer or planting strip— A zone separating pedestrians on sidewalks from moving vehicles on the road. • Marked crosswalk— Areas on the street (delineated by paint, brick, etc.) indicating to pedestrians where they should cross the road. • Curb ramp or curb cut— A ramp providing a smooth transition between sidewalk and street. • Raised medians and crossing islands— The median is the area between opposing lanes of traffic. These provide pedestrians with a safe place to wait while crossing a street. • Curb extension— An extension of the sidewalk into the street that reduces the distance pedestrians must cross. • Traffic sign— An official device that gives a specific message, either by words or symbols, to the public. Examples are "stop," "yield," etc.
FHWA Walkway and Bikeway List • Traffic signal— A visual signal to control the flow of traffic. Pedestrian signals let pedestrians know when they have priority and warn drivers to stop/yield for pedestrians. • Traffic calming— Physical changes to a street to encourage drivers to drive slowly or to discourage cut-through traffic. • Road diet— Narrowing or eliminating travel lanes on a roadway to make more room for pedestrians and bicyclists. • Overpasses/underpasses— A street crossing separating pedestrians from motor vehicle traffic (i.e., bridge or tunnel). • Street lighting— This illuminates the roadway and intersections to help motorists see other motor vehicles and pedestrians crossing the roadway. • Temporary walkways— These provide pedestrians with designated routes along a construction site when sidewalks and other pedestrian travel ways have been closed.
Photo by Heidi Potter What is a bike lane? Bike lanes lead to 30-40% reduction in bike crashes. The Safest Place to Ride In 1996, over 2,000 League of American Bicyclist members were surveyed about the accidents they were involved in over the course of the previous year. From the information, a relative danger index was calculated which shows that streets with bike lanes are the safest places to ride. The chart on the left shows the Facility Danger Index determined through the study. The findings of the 1996 LAB study are consistent with the findings of a similar study done by the LAB in 1974 (LAW 74), and another similar study done by Washington State in 1994 (WA 94). Source: William E. Moritz, Ph.D., “Adult Bicyclists In The United StatesCharacteristics And Riding Experience In 1996.” TRB Preprint Paper, 1998.
New Ideas: Mid-block crossings • People routinely cross at mid-block locations. • Well-designed mid-block crossings can provide many safety benefits to pedestrians when placed in proper locations.
New Ideas: Road Diets • A typical road diet technique is to reduce the number of lanes on a roadway cross-section. • One of the most common applications of a road diet is to improve safety in the context of two-way streets with 4-lane sections.
New Ideas: Road Diets • Road diets do not displace traffic, unless they have exceptionally high numbers. • Road diet ranges typically start at 8,000 vehicles per day, and climb to 19,000 vehicles per day. • At 20,000 vehicles-per-day the diet is called a "Super Road Diet." These diets range from 19,000 on up to about 23,000 vehicles per day. They are undertaken by replacing signals with roundabouts, and other means to keep traffic moving smoothly and uniformly.
Are Complete Streets Expensive? “By fully considering the needs of all non-motorized travelers (pedestrians, bicyclists, and persons with disabilities) early in the life of a project, the costs associated with including facilities for these travelers [later] are minimized.” Jeff Morales, former Director, CalTrans
Lansing’s Transportation Funding • Based on financial data from fiscal year 2007, the city of Lansing received $8,121,422.95 from the Michigan Transportation Fund. • Of these funds, a minimum of 1% is required to be spent on qualified non-motorized facilities including bike lanes, off road paths, sidewalks, etc. • This equates to $81,214.23 for the 2007 fiscal year.
2009 City of Lansing Road Repairs Total City Investment: $16.55 Million $1.4 Act 51 Projects $2.3 ARRA Projects $3.0 Emergency Bond Projects $2.33 STP Projects $7.52 CSO Streets
2009 City of Lansing Road Repairs 37.8 Total Miles Improved ARRA Projects 3.6 Miles MDOT Projects 11.4 Miles STP Projects 1.5 Miles CSO Projects 8.4 Miles Act 51 Projects 5.6 Miles Emergency Bonding 7.3 Miles
2009 City of Lansing Road Repairs Miles by Street Type Major Streets 13.2 Miles State Trunkline 11.8 Miles Local Streets 12.8 Miles
How Much Do Different “Complete Streets” Facilities Cost? If you are already working on the road and planning to resurface, do CSO, or anything else that requires re-striping, the cost of creating a “Complete Street” is minimal.
Sample Costs of Complete Streets Improvements Facility / Project Type Cost 4 to 3 lane conversion (re-striping only) $8,000 per mile (could include bike lanes) 4 to 3 lane conversion (w/ road work) $20,000 per mile On-road bike lane (5’ x 2 directions) $550,000 per mile (Cost for additional pavement, striping, and signs) Sidewalk installation $120,000 per mile/side **The cost of creating complete streets can be minimal, particularly if you are already resurfacing the road or re-striping