Download
1 / 30
300 likes | 304 Vues
A whole body model for both glucose and fatty acid metabolism. F.L.P. Sips. Outline. Adipocytes – how to make them important Lipid metabolism How can we combine glucose and FA on the whole body level? The glucose/FA model Results Adaptations Conclusions and future. Adipocytes.

E N D
A whole body model for both glucose and fatty acid metabolism F.L.P. Sips
Outline Adipocytes – how to make them important Lipid metabolism How can we combine glucose and FA on the whole body level? The glucose/FA model Results Adaptations Conclusions and future
Adipocytes Glucose Leptin Insulin Adiponectin NEFA Resistin
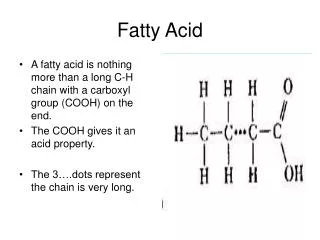
The importance of fatty acid metabolism ... to type II Diabetes - on all scales • Obesity • Dyslipidemia; elevated plasma triglycerides and non-esterified fatty acids • Increase in intracellular FA-derivatives may induce insulin resistance ... to glucose metabolism • Randle cycle – NEFA inhibit glucose uptake • NEFA stimulate endogenous glucose production ... to understanding whole body energy metabolism • More energy passes through FA metabolism than through glucose metabolism ... to a variety of organs • Liver • Intestines • Adipose tissue • Skeletal muscle ... after a meal
Differences between glucose and lipid metabolism • Triglycerides for transport or storage, fatty acids for use • Insoluble in water : lipoproteins • Endogenous lipoproteins – VLDL • Exogenous lipoproteins - Chylomicrons • Highly regulated but with large variations in fluxes and concentrations • Insulin, glucose, growth hormone, etc.
Can the glucose/insulin meal response model (Dalla Man et al.) be expanded with the response of non-esterified fatty acids?
NEFA models in literature NEFA concentrations depend only on glucose, with a delay Insulin and glucagon regulate storage and metabolism of glucose and NEFA. Delayed insulin regulates FA release and glucose uptake
Roy & Parker (2006) model Regulation by insulin and the Randle cycle • Insulin regulates glucose metabolism and NEFA uptake and release • Glucose regulates NEFA metabolism • NEFA regulate glucose metabolism Parametrized on dynamic data of different types • IVGTT, hyperinsulemic euglycemic clamp, lipid infusion Phemenological
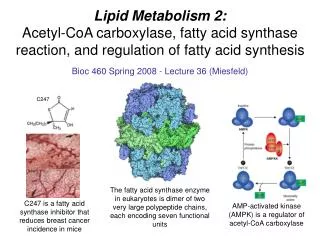
Lipoprotein lipase • Hydrolyzes triglycerides in lipoprotein – releases FA • FA released by LPL into the plasma depend on: • Lipoproteins in the blood (Triglyceride concentration) • Insulin concentration • Spillover Michaelis-Menten equation, modulated by insulin [K. Jelic; C. E. Hallgreen; M. Colding-Jørgensen. A Model of NEFA Dynamics with Focus on the Postprandial State. Annals of Biomedical Engineering, 2009, Vol. 37, No. 9, 1897-1909]
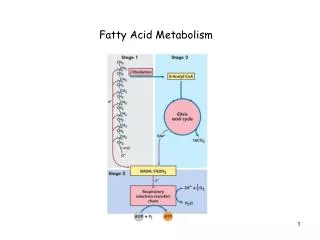
The glucose/NEFA model Renal extraction Endogenous glucose prod. Glucose Insulin-independent uptake Meal Insulin-dependent uptake Hepatic degradation Insulin Secretion (β cell) Peripheral degradation Adipose tissue storage Adipose tissue release NEFA Oxidation Lipoprotein lipase release Hepatic uptake Adipose tissue uptake TG
The glucose/NEFA model Renal extraction Endogenous glucose prod. Glucose Insulin-independent uptake Meal Insulin-dependent uptake Hepatic degradation Insulin Secretion (β cell) Peripheral degradation Adipose tissue storage Adipose tissue release NEFA Oxidation Lipoprotein lipase release Hepatic uptake Adipose tissue uptake TG
The glucose/NEFA model • Endogenous glucose production • Insulin-dependent glucose uptake Z(t) = Non-esterified fatty acid compartment X(t) = Insulin compartment
The glucose/NEFA model • Dose response data for • Endogenous glucose production • Insulin-dependent glucose uptake • NEFA response to insulin • Separate the response to fat from the response to glucose • Oral glucose tolerance test • Oral fat tolerance test • Meal data • Multiple meals • The response to a second meal will be different from the response to the first
Dose response data Glucose/insulin, insulin steps TG/ NEFA, insulin steps Glucose uptake, 6 experiments Endogenous glucose production Triglycerides (µmol/L), NEFA (µmol/L) Glucose (mg/dL), insulin (pmol/L) Glucose uptake (mg/min/kg) Endogenous glucose production (mg/min/kg) Time (min) Time (min) Experiment • Endogenous glucose production • Insulin-dependent glucose uptake • NEFA response to insulin concentrations NEFA (µmol/L)
Oral glucose tolerance test (OGTT) Oral Glucose Tolerance Test Glucose (mg/dL) Insulin (pmol/L) TG (μmol/L) and NEFA (μmol/L) Time (min) Time (min) • Initial response of NEFA to insulin • Recovery/rise
Oral fat tolerance test (OFTT) • Initial response of NEFA to insulin • Recovery/rise Oral Fat Tolerance Test Glucose (mg/dL) Insulin (pmol/L) TG (μmol/L) and NEFA (μmol/L) Time (min) Time (min)
Why doesn’t NEFA rise? • Glucose Insulin-dependent glucose uptake • NEFA inhibit insulin-dependent glucose uptake • No insulin = no inhibition • Insulin Incretin response • GLP-1 and GIP respond to a meal within minutes • The insulin response is potentiated by 50-60% • NEFA Spillover • Determined by intracellular reesterification
Insulin-dependent glucose uptake Glucose uptake, 6 experiments Glucose uptake (mg/min/kg) Experiment Fatty acids only inhibit insulin stimulated glucose uptake
Insulin-dependent glucose uptake Glucose uptake, 6 experiments Glucose uptake (mg/min/kg) Experiment Fatty acids only inhibit insulin stimulated glucose uptake
Insulin-dependent glucose uptake Glucose uptake, 6 experiments Glucose uptake (mg/min/kg) Experiment Fatty acids only inhibit insulin stimulated glucose uptake
Incretin hormones Model incretin effect • No stimulation at basal value • Response time of 5-10 minutes • Rapid de-activation, 2 minutes 50-60 % of both static and dynamic insulin secretion
Incretin hormones - results OGTT TG (μmol/L) and NEFA (μmol/L) Glucose (mg/dL) Insulin (pmol/L) OFTT TG (μmol/L) and NEFA (μmol/L) Glucose (mg/dL) Insulin (pmol/L) Time (min) Time (min) Time (min) Time (min)
Spillover • Intracellular reesterification • After a meal, spillover declines • The time course of this is comparable to LPL activation
Spillover - results OGTT TG (μmol/L) and NEFA (μmol/L) Glucose (mg/dL) Insulin (pmol/L) OFTT TG (μmol/L) and NEFA (μmol/L) Glucose (mg/dL) Insulin (pmol/L) Time (min) Time (min) Time (min) Time (min)
Conclusion • Lipid metabolism is neccesary on the whole body level • Glucose-insulin model can be expanded to contain • NEFA • Lipoprotein lipase spillover • Initial response to a meal or a glucose/fat dose could be reproduced • Return to fasting state can be reproduced with • Incretin hormones • Spillover, regulated by insulin
The glucose/NEFA Renal extraction Endogenous glucose prod. Glucose Insulin-independent uptake Meal Insulin-dependent uptake Hepatic degradation Insulin Secretion (β cell) Peripheral degradation Adipose tissue storage Adipose tissue release NEFA Oxidation Lipoprotein lipase release Hepatic uptake Adipose tissue uptake TG
Future • Fluxes for the hierarchical model • Incretin effect – • Oral glucose dose vs. intravenous glucose dose • Meal/ multiple meals • Fat ingestion is modeled to gut content • Lipoprotein metabolism