Download

1 / 34
380 likes | 756 Vues
Health Economics for Prescribers. Richard Smith (MED) richard.smith@uea.ac.uk David Wright (CAP) d.j.wright@uea.ac.uk. Workshop reminder. Group X = Cote et al . A pharmacy-based health promotion programme in hypertension. Pharmacoecon , 2003; 21: 415-428.

E N D
Health Economics for Prescribers Richard Smith (MED) richard.smith@uea.ac.uk David Wright (CAP) d.j.wright@uea.ac.uk
Workshop reminder • Group X = Cote et al. A pharmacy-based health promotion programme in hypertension. Pharmacoecon, 2003; 21: 415-428. • Group Y = Scuffham & Chaplin. An economic evaluation of fluvastatin used for the prevention of cardiac events following successful first percutaneous coronary intervention in the UK. Pharmacoecon, 2004; 22: 525-535. • Workshop 1 – checklist items 1, 2, 3 and 4-6 (re: costs) • Workshop 2 – checklist items 4-6 (re: benefits) and 7,8,9,10 • Read paper and checklist prior to workshop
Lecture 2 recap • The ‘why and what’ of economic evaluation • How it relates to other forms of evaluation • Types of economic evaluation – CMA, CEA, CUA, CBA
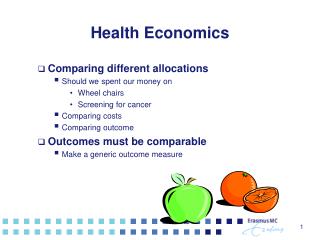
Type of Analysis Costs Consequences Result Cost Minimisation Money Identical in all respects. Least cost alternative. Cost Effectiveness Money Different magnitude of a common measure eg., LY’s gained, blood pressure reduction. Cost per unit of consequence eg. cost per LY gained. Cost Utility Money Single or multiple effects not necessarily common. Valued as “utility” eg. QALY Cost per unit of consequence eg. cost per QALY. Cost Benefit Money As for CUA but valued in money. Net £ cost: benefit ratio. Types of economic evaluation
Lecture 2 recap • The ‘why and what’ of economic evaluation • How it relates to other forms of evaluation • Types of economic evaluation – CMA, CEA, CUA, CBA • Stages in an economic evaluation
Deciding upon study question • Viewpoint taken. • Alternatives appraised. • Assessment of costs and benefits • Identification of relevant C&B. • Measurement of C&B. • Valuation of C (&B). Adjustment for timing. Adjustment for uncertainty. Making a decision. Stages in economic evaluation
Lecture 2 recap • The ‘why and what’ of economic evaluation • How it relates to other forms of evaluation • Types of economic evaluation – CMA, CEA, CUA, CBA • Stages in an economic evaluation • ‘Drummond’ checklist for appraisal • Items 1, 2 and 3 of checklist
‘Drummond’ checklist • Was a well-defined question posed in answerable form? • Was a comprehensive description of alternatives given? • Was there evidence that effectiveness had been established? • Were all the important and relevant costs and consequences for each alternative identified? • Were costs and consequences measured accurately/appropriately? • Were costs and consequences valued credibly? • Were costs and consequences adjusted for differential timing? • Was an incremental analysis performed? • Was allowance made for uncertainty? • Did presentation/discussion of results include all issues of concern?
Lecture 3: Pharmaco-economic evaluation – resources and costs • Identification (checklist 4) • Indirect costs • Measurement (checklist 5) • Fixed, variable and total cost • Average, marginal and incremental cost (checklist 8) • Discounting (checklist 7) • Valuation (checklist 6) • Cost versus price • Inflation • Sources of unit cost data
Resource use measurement and costing: overview of process • Identification: • Viewpoint/perspective. • Resources with an opportunity cost. • Measurement: • Measure in natural physical units (eg. hours of labour time). • Valuation: • Market prices (eg. wage rates) used unless strong belief they do not reflect opportunity cost (eg volunteers). • Calculation: • Multiply unit of measurement by unit cost (eg 2 hours of time at £5 per hour = £10 labour cost).
Intervention Direct Cost Indirect Costs Health services resource use. Eg. Inpatient, outpatient, tests, drugs Non-health services resource use. Eg. patient transportation, informal care Costs to family and friends. Wider cost implications to society eg. lost production. 1. Identification • Which to include depends on perspective taken
‘Indirect’ cost • Human capital approach (Rice and Cooper, 1967) • Gross wage as value of working and leisure time • Friction cost approach (Koopmanschap et al, 1992/3/5) • Labour markets usually exhibit involuntary unemployment • Value of productivity changes therefore accrue during short period of adjustment – the ‘friction period’ • Example: 1996 costs of premature mortality in Canada • $105 million using human capital method • $1.53 million using friction cost method • Criticisms of either method • Introduce bias as both based no wage rate (non-earners?) • Double counting if QALYs are outcome measure
2. Measurement of resource use • Need to quantify resource use in appropriate physical and natural units • hours, days, miles, dose etc • Direct costs are mostly assessed, and categorised as: • Capital costs (buildings, equipment) • Overheads (jointly used resources, such as heating and lighting, administration and catering) • Labour (medical and non-medical staff) • Consumables (disposable items, such as drugs, bandages etc)
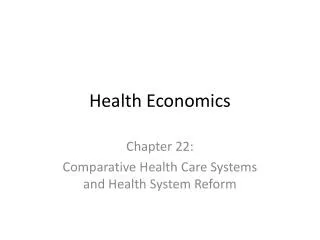
Fixed, variable and total cost • Fixed cost (FC) • costs that in the short run do not vary with quantity, usually capital, overheads (labour?) • Variable cost (VC) • costs which vary with the level of service, usually consumables (labour?) • Total cost (TC) • all costs incurred while producing a service • = FC + VC
TC VC FC Fixed, variable and total cost Cost Quantity
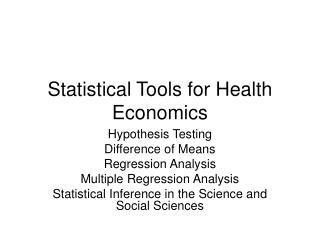
Average versus marginal cost • Average cost • cost per unit of output • Influenced by fixed cost • Marginal cost • cost of producing an extra unit • Influenced by variable cost
MC AC Average and marginal cost curves Cost Quantity
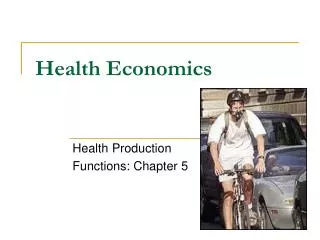
Cost TC of Prog A MCA, Q* ICA-B, Q* TC of Prog B MCB, Q* Q* Marginal versus incremental cost Quantity
Discounting • Prefer to have benefits now and bear costs in the future – ‘time preference’ • ‘Rate’ of time preference is termed ‘discount rate’ • To allow for differential timing of costs (and benefits) between programmes all future costs (and benefits) should be stated in terms of their present value using discount rate • Thus, future costs given less weight than present costs
Which discount rate? • 5%: used by US studies in the 70’s and 80’s, such that convention emerged • 3.5%: UK government recommended and used in other areas of public sector • In general, whatever rate used undertake sensitivity analysis (range often 2%-10%)
Specific use of discounting: capital costs • Capital costs represent an investment in an asset which is used over time • Purchased at the beginning of the programme and then depreciates over time • Two components • opportunity cost of initial investment • depreciation over time • In a evaluation, annualise the initial capital outlay over the useful life of the asset • calculate the equivalent annual cost E.g. If cost £1,200 (K), life expectancy 9 years (n), discount rate 6% (r) then E = £176
3. Valuation • Resources should be valued according to their opportunity cost • In most markets price is a good reflection of opportunity cost but health care provision is rarely subject to market valuations • Use of prices predominates but should be justified, and alternative ‘shadow’ prices may need to be used
S (MC) P=C D (MB) Q Price ≠ cost • Price = Cost only in a (perfectly) competitive market • Health care markets are rarely competitive • pharmaceuticals subject to bilateral monopolies and discounts • labour markets are imperfect • cross subsidisation • inefficiencies in production
Types of costing • Valuation is dependent on the form of measurement • Costing can be performed “top down” or “bottom up” • Average per diem, daily cost per patient • Disease-specific per diem, average daily cost for treatments within disease areas • Case-mix group, cost for each category (e.g. DRGs or HRGs) • Micro-costing, cost of each component of resource use • Choice between these is often dependent on data availability and time constraints
Sources of unit cost data • Published sources • Government (NHS reference costs) • previous research • provider accounts • BNF (British National Formulary) • Direct valuation (eg patient out-of-pocket expenses – travel, time, OTC, child care) • Questionnaires • Diaries
NHS ‘reference costs’ (prices) • Payment by Results (implementation of the national tariff from April 2005) • Based on hospital returns, within specific HRGs • Results in published unit costs which are “consistent” • day cases, elective and emergency procedures • 500 surgical procedures, almost 5 million episodes across 249 NHS Trusts • Limitations • excludes atypical episodes • costing methods are not standard • inconsistent definitions
Adjustments • Unit cost data may need to be adjusted for • Price inflation (costs from different years) • International currencies (costs from different countries)
Adjusting for price inflation • Hospital and Community Health Services (HCHS) pay and price index • weighted average of Pay Cost Index (PCI) and Health Service Cost Index (HSCI) • If we know the cost of a hip replacement in 2002/03 was £5,000 but we want it in 1998-99 prices:
Adjusting for international currencies • Purchasing Power Parities (PPPs) and exchange rates are two methods that are used to convert different currencies into a common denominator • PPPs are more appropriate than exchange rates as these eliminate the difference in price levels between countries • PPPs are calculated from a common basket of goods
Summary • Any evaluation must distinguish between identification, measurement and valuation of resource use • Identification • perspective is important • range of costs justified by perspective • Measurement • need to distinguish between fixed, variable and total cost, and average, marginal costs and incremental cost • may need to adjust for differential timing (discounting) • Valuation • method of valuation needs justification (incl. market prices) • price does not necessarily equate with cost • precision – ‘top down’ versus ‘bottom up’ • may need to adjust for inflation or currencies