Download
1 / 1
10 likes | 98 Vues
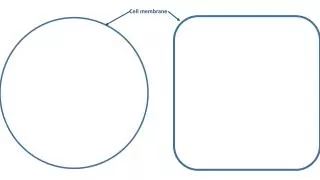
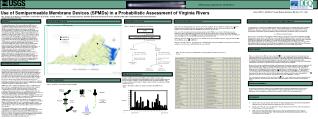
Learn how Semipermeable Membrane Devices (SPMDs) were used for monitoring organic contaminants in Virginia rivers. Gain insights into SPMD deployment, enrichment, analysis, and estimation of water concentrations.

E N D
Exterior Cleaning Dialysate SPMDs Dialytic Recovery Dialytic Extraction Enrichment and Fractionation Transport Sealed in can Post-Dialysis Composite of 3-SPMDs Sample Split (50:50) Exposed SPMD Chromatographic Analysis PAH Fraction PCB/OCP Fraction SEC with Chemical Class Appropriate Collect Window SEC with Chemical Class Appropriate Collect Window Gravity Column Cleanup (TriAdsorbent Cleanup) Gravity Column Cleanup (Florisil) Gravity Column Cleanup & Fractionation (Silica Gel) GC-MSD Analysis For PAHs PCB Fraction GC-ECD Analysis OCP Fraction GC-ECD Analysis ng/SPMD CERC Site ID → Deployment # 1 Deployment # 2 USEPA Assistance Agreement No: CR-830796-01-3 Use of Semipermeable Membrane Devices (SPMDs) in a Probabilistic Assessment of Virginia Rivers Poster # RP016 – SETAC 26th Annual Meeting, Baltimore, MD, Nov. 13-17, 2005 W.L. Cranor1, D.A. Alvarez1, J.N. Huckins1, S.D. Perkins1, R.C. Clark1, and R.E. Stewart21 U.S. Geological Survey, Columbia Environmental Research Center, Columbia, MO, USA; 2 Virginia Department of Environmental Quality, Richmond VA, USA. ABSTRACT SPMD DEPLOYMENT SITES ENRICHMENT & ANALYSIS SPMD ANALYSIS RESULTS (Continued) CALCULATION OF WATER CONCENTRATIONS FROM SPMD DATA The Virginia Department of Environmental Quality (VDEQ) has been charged with monitoring factors which may be indicators of water quality in free flowing freshwater streams and in estuarine waters. The VDEQ has adopted a strategy which incorporates a probabilistic monitoring program, consisting of all non-tidal perennial streams and rivers within the Commonwealth of Virginia. As an integral part of this much larger study, lipid-containing semipermeable membrane devices (SPMDs) were used to sample ultra-trace (i.e., < ng/L) and trace (ng/L to mg/L) levels of hydrophobic organic contaminants in the water column of selected streams. The SPMDs were prepared by US Geological Survey (USGS) scientists and replicate samplers were deployed and recovered from 46 of the 50 sites by VDEQ personnel (Figure 1). The SPMDs were processed and analyzed by USGS (Figure 2) to determine concentrations of polycyclic aromatic hydrocarbons (PAHs), polychlorinated biphenyls (PCBs), organochlorine pesticides (OCPs), and selected current-use pesticides including trifluralin, diazinon, dacthal, chlorpyrifos, endosulfans, and permethrins in stream waters. A number of OCPs, PAHs, and current use pesticides were detected in SPMDs at most sites. However, only pentachloroanisole (PCA; a microbial methylation product of the wood-preservative pentachlorophenol) was found at quantifiable levels at every site analyzed. Elevated levels of PCBs were found only at two sites. The highest concentrations of individual PAHs at sample sites were phenanthrene, fluoranthene and pyrene. This observation is typical of PAH concentrations in environmental waters where these chemicals originate from pyrogenic sources. Previously developed models were employed to estimate aqueous concentrations of contaminants of concern in the water columns of the rivers studied. Figure 1. Site Locations for SPMD Deployments Figure 3. Sample Processing and Analysis Flow Chart Many of the sites had measurable levels of some of the historic use OCPs, which included the chlordanes, the nonachlors, hexachlorobenzene, dieldrin and endrin. Methoxychlor was quantifiable at six sites, but the observed level at site 9-SNK019.59 was eight times higher (37 ng/SPMD) than at any of the other five sites. Every one of the six targeted current-use pesticides was detected in SPMDs at one or more of the 46 exposure sites. Diazinon was detected in SPMDs more frequently (26 of the 46 sites) than any other current-use pesticide. All Diazinon levels were below the MQL (18 ng/SPMD). The amounts of Endosulfan, Endosulfan-II, and Endosulfan Sulfate in SPMDs were above their MQLs (2.6, 1.8, & 3.3 ng/SPMD respectively) at over half of the sites. PCBs were detected in SPMDs at only two sites. Total PCBs, as the sum of individual congeners, was greater than the MQL (65 ng/SPMD) at only one site, 3-MTN003.31. PAHs were detected at all sites. The highest levels of individual PAHs measured in SPMDs were phenanthrene, fluoranthene and pyrene. In several cases, methylated PAHs were also observed. To estimate water concentrations from SPMD amounts with a reasonable degree of certainty, the amounts of targeted contaminants and one or more performance reference compound (PRC) must be accurately measured in exposed SPMDs. Also, appropriate calibration data for both target compounds and PRCs must be available (1). The overall accumulation of contaminant residues by SPMDs is related to that specific contaminants’ water concentration by Cw = N/(VsKsw[1exp(Rst/VsKsw)]) where Cw is the concentration of the chemical in ambient water, N is the amount of the chemical sampled by an SPMD (typically ng), Vs is the volume of an SPMD (L), Ksw is the equilibrium SPMD-water partition coefficient, Rs is the SPMD sampling rate (L/d) and t is the exposure time (d). Site specific in situ sampling rates were derived for target compounds using exposure adjustment factors (EAFs) to correct laboratory derived Rs values. The EAF is a ratio that is approximately equivalent to the in situ sampling rate of a selected PRC divided by the sampling rate of the same PRC from calibration data (2). Then, the in situ or site specific sampling rate (Rsi) of an analyte is the EAF times its laboratory calibration Rs. Perdeuterated PAHs, phenanthrene-d10 and pyrene-d10, were used as PRCs in this study. 3-MTN003.31 9-SNK019.59 CONCLUSIONS Table I. Frequency of Detection and Quantitation of Targeted Analytes (number observed out of 46 sites) Water concentration of total PCBs (2.1 ng/L) at site 3-MTN003.31 was elevated compared to the background levels observed at all other sites. This aqueous concentration was the only contaminant level observed in the study at a sufficiently high level to classify the stream as “Impaired.” Interestingly, this stream had previously been classified, by the Virginia Department of Environmental Quality, as “Impaired” based on PCB levels in fish tissue. Water concentrations of all targeted contaminants (Table I) were well below (orders of magnitude) levels which would trigger classification of the stream as “Impaired” based on organic contaminant concentrations. Because of the toxicity and ubiquitous distribution of phenanthrene, fluoranthene and pyrene, they are listed by the US Environmental Protection Agency as priority pollutants (PP). Water concentration estimates of these PP PAHs are typical of published data on PAH concentrations in environmental waters. These chemicals often originate from pyrogenic sources. Methylated PAHs, also observed, are characteristic of petrogenic sources. The dissolved phase concentrations of these PP PAHs approach ng/L (i.e. ppt) concentrations (e.g. site 3-MTN003.31 ). Of particular concern is that phototoxic fluoranthrene and pyrene represent two of the three highest PAHs found in study waters. Fluoranthrene has been shown to be toxic to fish fry during solar radiation cycles, when water concentrations approach 5-ng/L. This level of fluoranthene was approached only at site 3-MTN003.31 (4.3 ng/L). The concentration of methoxychlor (0.33 ng/L) at site 9-SNK019.59 is also well below a level which would classify a stream as “Impaired.” However, specific note is taken in that methoxychlor is only rarely seen in environmental waters. EXPERIMENTAL DESIGN This work was conducted as part of a collaborative effort between the U.S. Geological Survey’s (USGS) Columbia Environmental Research Center (CERC) and the Virginia Department of Environmental Quality (VDEQ). The study was designed to satisfy, in part, the Code of Virginia, § 62.1-44.19:5, water quality and reporting requirements, which include expanding the percentage of river and stream miles monitored and providing information about trace levels of toxic organic compounds in riverine water columns. The focus of the much larger study, which includes this work, is the probalistic assessment of benthic macro-invertebrate populations, standard water quality chemistry, metals and toxic organic contaminants in sediments, and dissolved organics in Virginia water columns. SPMDs were used to sample the hydrophobic-organic contaminants in the water columns of selected streams within the Commonwealth of Virginia. Prior to the advent of SPMD technology, ultra-trace levels of many contaminants in water were often below the detection limits of most commonly employed low volume (i.e., 5 L) sampling methods. Also, the probabilities of detecting chemicals from episodic discharge events were very low, because sampling with conventional methods only provides concentration data on a single point in time. When sampling is integrative and uptake is linear (1 to 10 L/d), residue concentrations in SPMDs represent time weighted average (TWA) concentrations of exposure water. SPMDs were deployed for 27 to 86 days during the Spring (Deployment # 1) and Fall (Deployment # 2) of 2003. Extracts of exposed SPMDs were analyzed (Figure 3) to determine ultra-trace (i.e., < ng/L) and trace (ng/L to mg/L) concentrations of polycyclic aromatic hydrocarbons (PAHs), polychlorinated biphenyls (PCBs), organochlorine pesticides (OCPs), and selected current-use pesticides. Previously developed models (1) were employed to estimate water concentrations of contaminants of concern in the water columns of the rivers studied. Water concentrations were derived from SPMD levels using published calibration data and an Excel-based water concentration calculator. In the case of water concentrations derived from SPMD data, a maximum two-fold difference between SPMD derived water concentrations and independently measured values would be expected. SPMD ANALYSIS RESULTS A number of OCPs were detected in SPMDs at all sites (Table 1). However, only pentachloroanisole (PCA) was found at quantifiable levels at every site analyzed. Although PCA is classified as an OCP, it is produced in water by the microbial methylation of the wood-preservative pentachlorophenol. Figure 4 shows how PCA concentrations in SPMDs vary from site to site. SAMPLE PROCESSING ACKNOWLEDGEMENTS Figure 2. General Processing Steps for Deployed SPMDs Figure 4. Distribution of PCA Concentrations in Samples (ng/SPMD) Across Sites We gratefully acknowledge the funding of the Virginia Department of Environmental Quality and specifically the support of Roger Stewart and other Virginia Department of Environmental Quality personnel involved in the deployment, retrieval, shipment, and delivery of these samples to CERC for processing and analysis. REFERENCES • Huckins, J.N., Petty, J.D., Booij, K. 2005. Monitors of Organic Chemicals in the Environment: Semipermeable Membrane Devices. Springer Publishing Company, New York, NY, USA, In Press. • Huckins, J.N., Petty, J.D., Lebo, J.A., Almeida, F.V., Booij, K., Alvarez, D.A., Cranor, W.L., Clark, R.C., Mogensen, B. 2002. Environ. Sci. Technol. 36: 85-91. • 3) NOTE: Also see Poster RP210 entitled “The Occurrence and Geospatial Distribution of Toxic Organic Contaminants in a Statewide Stratum” SETAC North America 26th Annual Meeting, Baltimore, MD. Poster Session RP15 on Nov. 17th 2005.