Download
1 / 28
360 likes | 643 Vues
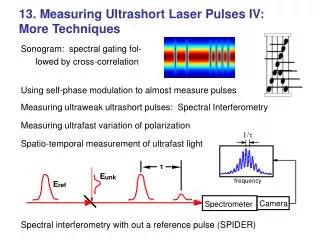
13. Measuring Ultrashort Laser Pulses IV: More Techniques. 1/t. t. E. unk. E. ref. frequency. Camera. Spectrometer. Sonogram: spectral gating fol- lowed by cross-correlation Using self-phase modulation to almost measure pulses

E N D
13. Measuring Ultrashort Laser Pulses IV: More Techniques 1/t t E unk E ref frequency Camera Spectrometer Sonogram: spectral gating fol- lowed by cross-correlation Using self-phase modulation to almost measure pulses Measuring ultraweak ultrashort pulses: Spectral Interferometry Measuring ultrafast variation of polarization Spatio-temporal measurement of ultrafast light Spectral interferometry with out a reference pulse (SPIDER)
The Sonogram and its relation to the spectrogram time frequency They’re experimentally very different, but mathematically equivalent. Spectrogram frequency time Spectrogram: “What frequencies occur at a given time?” Sonogram Sonogram: “At what times does a given frequency occur?”
Measuring Sonograms of Pulses Using a Shorter Event Fast Photodetector or Cross Correlator The shorter event Tunable Optical Filter Optical signal Oscilloscope E(w) H(w-wc) wc= filter center frequency Computer SnE(wc,t) To make a sonogram, we must frequency-filter and then measure the intensity of the filtered pulse vs. the central frequency of the filter. Requirements: a tunable filter with sufficient frequency resolution and a fast photodiode or cross-correlator with sufficient temporal resolution
Sonogram of a 10 Gbps Differential-Phase-Shift-Keying Signal Theory: Exp’t: 2 0 1 0 Frequency (GHz) 0 - 1 0 - 2 0 - 0 . 2 0 0 . 2 0 . 4 0 . 6 0 . 8 1 Time (ns) - 0 . 2 0 0 . 2 0 . 4 0 . 6 0 . 1 8 Differential phase shift keying (DPSK) involves amplitude modulation from -1 to +1 and back (phase shifts from 0 to π). So the intensity remains constant. The phase shifts appear clearly as dark (blue) regions of the sonogram. Time (ns) Kuznetsov and Caplan, Lincoln Lab CLEO 2000
Measuring the sonogram using the pulse itself Treacy (1971), and Chilla & Martinez (1991) This method uses the pulse itself to cross-correlate the filtered (lengthened) pulse.
Advantages and Disadvantages of theSonogram Advantages Approximate non-iterative retrieval is possible. The FROG algorithm can be modified to retrieve pulses from the sonogram rigorously. No ambiguity in the direction of time. Disadvantages Non-iterative retrieval is so rough that it shouldn’t be used (mean vs. median vs. mode…). More difficult experimentally than the spectrogram. Less sensitive, since energy is wasted at the filter before the crystal. Single-shot operation is difficult. Error-checking and error-correction are not straightforward.
Pulse Measurement Using Self-Phase Modulation Piece of glass
Measuring Ultraweak Ultrashort Light Pulses 1/t t E unk E ref frequency Camera Spectrometer Because ultraweak ultrashort pulses are almost always created by much stronger pulses, a stronger reference pulse is always available. Use Spectral Interferometry This involves no nonlinearity! ... and only one delay! FROG + SI = TADPOLE (Temporal Analysis by Dispersing a Pair Of Light E-fields) Froehly, et al., J. Opt. (Paris) 4, 183 (1973) Lepetit, et al., JOSA B, 12, 2467 (1995) C. Dorrer, JOSA B, 16, 1160 (1999) Fittinghoff, et al., Opt. Lett., 21, 884 (1996).
Central peak contains only spectrum information This is not “the” time domain. We’re Fourier-transforming an intensity. So we’ll put “time” in quotations. FFT “time” 0 Filter out these two peaks Filter & Shift Spectral Phase Difference (after taking phase of result) IFFT w0 w0 Frequency Frequency “time” 0 Subtracting off the spectral phase of the reference pulse yields the unknown-pulse spectral phase. Interferogram Analysis, D. W. Robinson and G. T. Reid, Eds., Institute of Physics Publishing, Bristol (1993) pp. 141-193 SI allows us to obtain the differencebetween the two spectral phases. Spectral Interfer- ometry Spectrum
Sensitivity of Spectral Interferometry (TADPOLE) – 6 1 microjoule = 10 J – 9 1 nanojoule = 10 J A pulse train containing only 42 zepto- joules (42 x 10-21 J) per pulse has been measured. That’s one photon every five pulses! Fittinghoff, et al., Opt. Lett. 21, 884 (1996). – 12 1 picojoule = 10 J – 15 1 femtojoule = 10 J – 18 1 attojoule = 10 J TADPOLE can measure pulses – 21 with as little energy as: 1 zeptojoule = 10 J
Frequency domain interferometric second-harmonic (FDISH) spectroscopy Applications of Spectral Interferometry The phase of the second harmonic produced on the MOS capacitor is measured relative to the reference second harmonic pulse produced by the SnO2 on glass. A p phase shift is seen at –4 V. P. T. Wilson, et al., Optics Letters, Vol. 24, No. 7 (1999)
Unpolarized light doesn’t exist… POLLIWOG (POLarization-Labeled Interference vs. Wavelength for Only a Glint*) * Glint = “a very weak, very short pulse of light”
Application of POLLIWOG Measurement of the variation of the polarization state of the emission from a GaAs-AlGaAs multiple quantum well when heavy-hole and light-hole excitons are excited elucidates the physics of these devices. Excitation-laser spectrum and hh and lh exciton spectra Evolution of the polarization of the emission: time (fs) A. L. Smirl, et al., Optics Letters, Vol. 23, No. 14 (1998)
Measuring the Intensity and Phase vs. Time and Space With Slide Spectral interferometry only requires measuring one spectrum. Using the other dimension of the CCD camera for position, we can measure the pulse along one spatial dimension, also. Microscope Slide Fringe spacing is larger due to delay produced by slide (ref pulse was later). Without Slide
Application of Spatio-Temporal Pulse Measurement: Plasma Diagnostics Use three pulses (in order): 1. a reference pulse, 2. a strong pump pulse (from a different direction) to create a plasma, 3. a probe pulse, initially identical to the reference pulse. Set up: Results: To spectro- meter Geindre, et al., Opt. Lett., 19, 1997 (1994).
Spatio-temporal intensity and phase measurements will be useful for studying: • Spatial distortions in stretchers/compressors. • Pulse front distortions due to lenses. • Structure of inhomogeneous materials. • Pulse propagation in plasmas and other materials • Anything with a beam that changes in space as well as time!
Spectral Interferometry: Experimental Issues The interferometer must be stable, the beams must be very well aligned, and the beams must be mode-matched. Mode-matching is important or the fringes wash out. The time delay must be stable or the fringes wash out. Unknown CW background in the laser can add to the signal and mask it. Spectrometer Beams must be perfectly collinear or the fringes wash out. Phase stability is crucial or the fringes wash out.
Spectral Interferometry: Pros and Cons • Advantages • It’s simple—requires only a beam-splitter and a spectrometer • It’s linear and hence extremely sensitive. Only a few • thousand photons are required. • Disadvantages • It measures only the spectral-phase difference. • A separately characterized reference pulse is required to • measure the phase of a pulse. • The reference pulse must be the same color as the • unknown pulse. • It requires careful alignment and good stability—it’s an • interferometer.
Using spectral interferometry to measure a pulse without a reference pulse: SPIDER If we perform spectral interferometry between a pulse and itself, the spectral phase cancels out. (Perfect sinusoidal fringes always occur.) It is, however, possible to use a modified version of SI to measure a pulse, provided that a nonlinear effect is involved. The trick is to frequency shift one replica of the pulse compared to the other. This is done by performing sum-frequency generation between a strongly chirped pulse and a pair of time-separated replicas of the pulse. SI performed on these two up-shifted pulses yields essentially the derivative of the spectral phase. This technique is called: Spectral Phase Interferometry for Direct Electric-Field Reconstruction (SPIDER). Iaconis and Walmsley, JQE 35, 501 (1999).
How SPIDER works Input pulses Output pulses Chirped pulse Two replicas of the pulse are produced, each frequency shifted by a different amount. t This pulse sums with the green part of the chirped pulse. This pulse sums with the blue part of the chirped pulse. t t t SFG Performing SI on these two pulses yields the difference in spectral phase at nearby frequencies (separated by dw). This yields the spectral phase. Iaconis and Walmsley, JQE 35, 501 (1999).
SPIDER apparatus Focusing Lens Delay Line Lens Spectrometer M Filter SHG crystal BS Aperture Delay Line Pulse Stretcher BS Michelson Interferometer Grating Input Grating BS BS SPIDER yields the spectral phase of a pulse, provided that the delay between the pulses is larger than the pulse length and the resulting frequency fringes can be resolved by the spectrometer.
SPIDER: extraction of the spectral phase Extraction of the spectral phase Measurement of the interferogram Extraction of their spectral phase difference using spectral interferometry Integration of the phase Experimental measurement: L. Gallmann et al, Opt. Lett., 24, 1314 (1999)
Can we simplify SPIDER? SPIDER has 12 sensitive alignment degrees of freedom. Pulse to be measured Michelson Interferometer 5 alignment parameters (q, f for each BS and delay) Variable delay Camera SHG crystal Spec- trom- eter Variable delay Pulse Stretcher 4 alignment parameters q (q for each grating and q, f for the mirror) Grating 3 alignment q parameters q (q, f for a mirror and q delay) q What remains is a FROG!!! Grating
Advantages and Disadvantages of SPIDER Advantages Pulse retrieval is direct (i.e., non-iterative) and hence fast. Minimal data are required: only one spectrum yields the spectral phase. It naturally operates single-shot. Disadvantages Its apparatus is very complicated. It has 12 sensitive alignment parameters (5 for the Michelson; 4 in pulse stretching; 1 for pulse timing; 2 for spatial overlap in the SHG crystal; not counting the spectrometer). Like SI, it requires very high mechanical stability, or the fringes wash out. Poor beam quality can also wash out the fringes, preventing the measurement. It has no independent checks or feedback, and no marginals are available. It cannot measure long or complex pulses: TBP < ~ 3. (Spectral resolution is ~10 times worse than that of the spectrometer due to the need for fringes.) It has poor sensitivity due to the need to split and stretch the pulse before the nonlinear medium. The pulse delay must be chosen for the particular pulse. And pulse structure can confuse it, yielding ambiguities.