
Overfished B/Bmsy ≤ 0.5
Overfishing F/Fmsy ≥ 1. Overfished B/Bmsy ≤ 0.5. Overfished Declaration 2000. Rebuilding Plan 2003- no end date. Figure A1. Northeast Region barndoor skate has a controlled fishing mortality and biomass is rebuilding. B msy proxy is in kg/tow.

Overfished B/Bmsy ≤ 0.5
E N D
Presentation Transcript
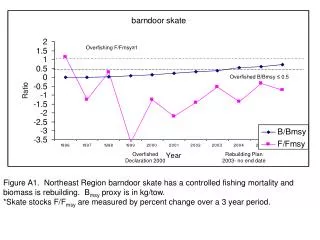
Overfishing F/Fmsy≥1 Overfished B/Bmsy ≤ 0.5 Overfished Declaration 2000 Rebuilding Plan 2003- no end date Figure A1. Northeast Region barndoor skate has a controlled fishing mortality and biomass is rebuilding. Bmsy proxy is in kg/tow. *Skate stocks F/Fmsy are measured by percent change over a 3 year period.
F/Fmsy for initial overfished declaration OverfishingF/Fmsy≥1 OverfishedB/Bmsy ≤ 0.5 Rebuilding Plan 2001-2009 Overfished Declaration Figure A2. Northeast Region bluefish (except Gulf of Mexico) has a controlled fishing mortality and biomass is rebuilding.
Overfishing F/Fmsy≥1 Overfished B/Bmsy ≤ 0.625 Rebuilding Plan 2000-2026 Overfished Declaration Figure A3. Northwest Region bocaccio has a controlled fishing mortality and biomass is rebuilding as expected.
Overfishing F/Fmsy≥1 Overfished B/Bmsy ≤ 0.625 Rebuilding Plan 2001-2063 Overfished Declaration Figure A4. Northwest Region canary rockfish has a controlled fishing mortality and biomass is rebuilding as expected.
Overfishing F/Fmsy≥1 Overfished B/Bmsy ≤ 0.625 Rebuilding Plan 2001-2039 Overfished Declaration Figure A5. Northwest Region cowcod has a controlled fishing mortality and biomass is rebuilding as expected.
Overfishing F/Fmsy≥1 B/Bmsy for initial overfished declaration Overfished B/Bmsy ≤ 0.625 Rebuilding Plan 2002-2011 Overfished Declaration 2000 Figure A6. Northwest Region darkblotched rockfish has a controlled fishing mortality and biomass is rebuilding as expected.
Overfishing F/Fmsy≥1 Overfished B/Bmsy ≤ 0.5 Rebuilding Plan 2001-2011 Overfished declaration Figure A7. Northeast Region golden tilefish has a controlled fishing mortality and biomass is rebuilding.
Assessment values for initial overfished declaration Overfishing F/Fmsy≥1 Overfished B/Bmsy ≤ 0.5 Overfished declaration Rebuilding Plan 2004-2014 Figure A8. Northeast Region haddock – Georges Bank has a controlled fishing mortality and biomass is rebuilding.
Assessment values for initial overfished declaration Overfishing F/Fmsy≥1 Overfished B/Bmsy ≤ 0.5 Rebuilding Plan 2004-2014 Overfished declaration Figure A9. Northeast Region haddock – Gulf of Maine has a controlled fishing mortality and biomass has increased following the overfished declaration. Bmsy proxy is in kg/tow.
Overfishing F/Fmsy≥1 Overfished B/Bmsy ≤ 0.8 or MSST Rebuilding Plan No start or end date Overfished Declaration Figure A10. South Atlantic Region king mackerel – Gulf of Mexico has a controlled fishing mortality and biomass is rebuilding as expected. Bmsy proxy is in trillions of eggs.
Overfishing F/Fmsy≥1 Overfished B/Bmsy ≤ 0.625 Rebuilding Plan 2004-2017 Overfished Declaration Figure A11. Northwest Region Pacific ocean perch has a controlled fishing mortality and biomass is rebuilding as expected. *Declared overfished in 1999 B/Bmsy was assumed < 0.5.
Overfishing F/Fmsy≥1 Overfished B/Bmsy ≤ 0.5 Rebuilding Plan 2004-2014 Overfished Declaration Figure A12. Northeast Region pollock has a controlled fishing mortality and biomass is rebuilding. Bmsy proxy is in kg/tow.
Assessment values for initial overfished declaration Overfishing F/Fmsy≥1 Overfished B/Bmsy ≤ 0.775 Or MSST Overfished Declaration 2000 Rebuilding Plan 2000-2016 Figure A13. South Atlantic Region red porgy has a controlled fishing mortality and biomass is rebuilding as expected.
Overfishing F/Fmsy≥1 Overfished B/Bmsy ≤ 0.5 Rebuilding Plan 2004-2051 Overfished declaration Figure A14. Northeast Region redfish has a controlled fishing mortality and biomass is rebuilding.
F/Fmsy for initial overfished declaration Overfishing F/Fmsy≥1 Overfished B/Bmsy ≤ 0.5 B/Bmsy for initial overfished declaration Rebuilding Plan 2004-2014 Overfished declaration Figure A15. Northeast Region spiny dogfish has a controlled fishing mortality and biomass is rebuilding. Bmsy proxy is in female biomass.
F1995/Fmsy =2.05 for initial overfished declaration Overfishing F/Fmsy≥1 Overfished MSST = B/Bmsy 0.8 B/Bmsy for initial overfished declaration Rebuilding Plan 2000-2010 Overfished declaration Figure A16. Highly Migratory Species swordfish - North Atlantic has a controlled fishing mortality and biomass is rebuilding. FMP not internationally implemented
F/Fmsy* = 2.19 for initial overfished declaration Overfishing F/Fmsy≥1 Overfished B/Bmsy ≤ 0.625 B/Bmsy for initial overfished declaration Rebuilding Plan 2002-2015 Overfished Declaration Figure A17. Northwest Region widow rockfish has a controlled fishing mortality and biomass is rebuilding as expected.
Assessment values for initial overfished declaration Overfishing F/Fmsy≥1 Overfished B/Bmsy ≤ 0.625 Overfished Declaration 2002 Rebuilding Plan 2003-2084 Figure A18. Northwest Region yelloweye rockfish has a controlled fishing mortality and biomass is rebuilding as expected.