Download
1 / 16
160 likes | 301 Vues
Analysis of Process Maturity and Productivity with SRDR Data. USC CSSE Annual Research Review April 29 – May 1, 2014 Anandi Hira, Jo Ann Lane. Outline. Motivation Explanation of the SRDR Data Repository Data Processing Analysis Procedure Results of Analyses per Taxonomy and Comparison

E N D
Analysis of Process Maturity and Productivity with SRDR Data USC CSSE Annual Research Review April 29 – May 1, 2014 Anandi Hira, Jo Ann Lane
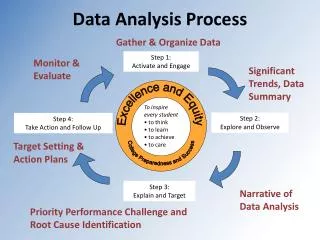
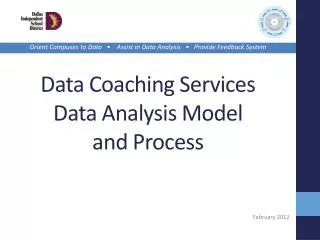
Outline • Motivation • Explanation of the SRDR Data Repository • Data Processing • Analysis Procedure • Results of Analyses per Taxonomy and Comparison • COCOMO IIComparisons • Application Domains • Productivity Types • Factors to Consider in Productivity Analysis -> Future Work • Parameter Suggestions for Future Research and Analyses • Questions/Suggestions
Motivation • Improve Productivity • Invest resources to improve processes • Process Certification Productivity ? • SRDR Data
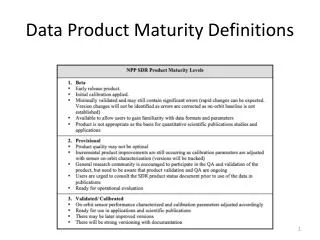
SRDR Data • Relevant Parameters provided: • Total Effort (hours) • Equivalent Total SLOC • SLOC Counting Method • CMM/CMMI Levels • Unused Parameters • Effort distribution per phase, Programming language(s), Personnel Experience • Software Resources Data Reporting (SRDR) • Quantitative data and associated parametric project characteristics • DoD software-intensive system development projects • Data analysis and trends research
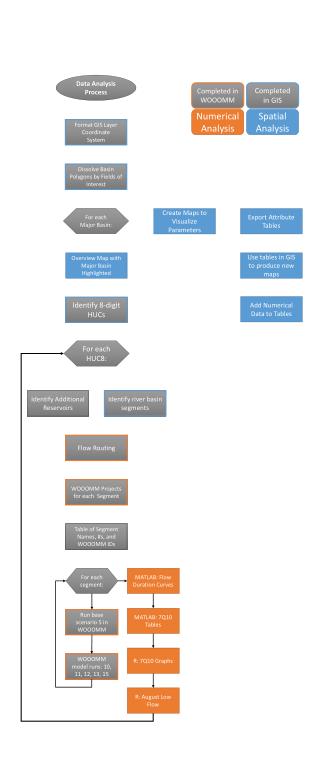
Data Processing • Normalizing Data • Logical SLOC • Counting adjustment factors • Non-comment: 0.66 * SLOC • Physical: 0.34 * SLOC • Filtering Data • Remove outliers • Remove points without relevant parameters • Projects < 10 EKSLOC • Levels 2 and 4
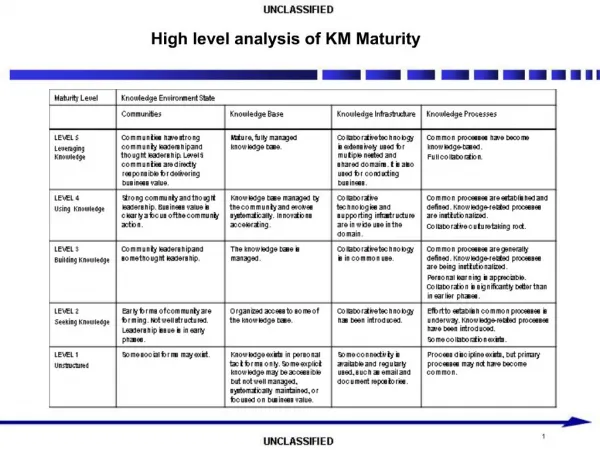
Findings and Conclusions • COCOMOComparisons • Data broken up by sizes do not closely correspond to parameter ratings • Average of all data corresponds to parameter rating • Application Domains and Productivity Types • Inconsistence with regards to productivity increase/decrease from Level 3 to Level 5 • Difference in productivity ranges of Level 3 and 5 are statistically insignificant
Future Work – Factors to Consider • Cost drivers and parameters that effect productivity not provided and random with respect to time • Staff experience • Tool support • Code reuse • Improved architecting and risk resolution • Counting methods not standard and may skew analysis • Code reuse gains factored and normalized in data • Analysis of trends of productivity over time • IDPD
Future Work – Parameter Suggestions • (Relative) Time of Project Implementation • Other data points • Adopting process maturity levels • Equivalent Metric for Non-Development Effort • Equivalent Output Metric per Phase/Activity • Rework SLOC and Effort • Volatility • Complexity