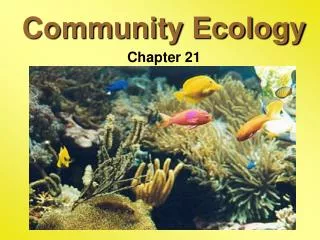
Chapter 21: Community Structure
Chapter 21: Community Structure. Robert E. Ricklefs The Economy of Nature, Fifth Edition. What is a community?. Ecologists have puzzled for almost a century over how to define a community, the assemblage of species that occur together in the same place.


Chapter 21: Community Structure
E N D
Presentation Transcript
Chapter 21: Community Structure Robert E. Ricklefs The Economy of Nature, Fifth Edition (c) 2001 by W. H. Freeman and Company
What is a community? • Ecologists have puzzled for almost a century over how to define a community, the assemblage of species that occur together in the same place. • Although ecologists agree that coexisting species interact strongly through consumer-resource and competitive interactions, they do not agree about what a community is. • two extreme views have dominated the debate over the nature of the community: • F.E. Clements’s discrete unit • H.A. Gleason’s loose assemblage of species (c) 2001 by W. H. Freeman and Company
The Community View of Frederic E. Clements • Clements saw the community as a superorganism in which the functions of various species are connected like the parts of the body. • Clements’s view included the following ideas: • that component species had coevolved so as to enhance their interdependent functioning • that communities were discrete entities with recognizable boundaries (c) 2001 by W. H. Freeman and Company
The Community View of Henry A. Gleason • Gleason saw the community as a fortuitous association of species whose adaptations and requirements enable them to live together under the particular conditions of a particular place. • Gleason’s view included the following ideas: • that component species occurred together largely by coincidence • that there was no distinct boundary where one community meets another (c) 2001 by W. H. Freeman and Company
Biological Communities • every place on earth is shared by many coexisting organisms: • these plants, animals, and microbes are linked to one another by their feeding relationships and other interactions, forming a complex whole referred to as a biological community: • ecologists are uncertain as to the factors that determine the number of species that can coexist (c) 2001 by W. H. Freeman and Company
Diverse Concepts of Community • The holistic concept of Clements and others recognizes that we can only understand each species in terms of its contributions to the dynamics of the entire system. • The individualistic concept of Gleason and others recognizes that community structure and function simply express the interactions of individual species, and do not reflect any organization above the species level. (c) 2001 by W. H. Freeman and Company
Community Concepts - A Middle Ground? • An intermediate or mixed view of communities also exists, which: • accepts the individualistic view that most interactions are antagonistic and that communities are haphazard assemblages of species • accepts the holistic premise that some attributes of communities arise from interactions among species, reinforced through coevolution (c) 2001 by W. H. Freeman and Company
Ecologists use several measures of community structure. • One of the most widely used measures of community structure is the number of species it includes, or species richness: • this measure captures differences among tropical, temperate, and boreal regions: • 16 km2 Barro Colorado Island in Panama supports 211 tree species, more than in all of Canada • plots of 1 hectare in Amazonian Peru and Ecuador support more than 300 tree species (c) 2001 by W. H. Freeman and Company
Ecologists use several measures of community structure. • Because biological communities contain large numbers of species, it is helpful to partition diversity into numbers of species at each trophic level (such as herbivores): • within trophic levels, method or location of foraging distinguishes guilds of species (such as leaf eaters within the herbivore trophic level) • Patterns of relative abundance also permit ecologists to quantify structure of communities. (c) 2001 by W. H. Freeman and Company
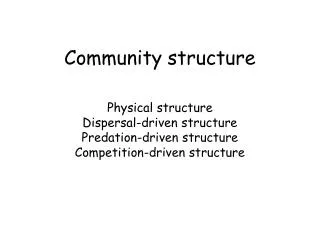
“Community” has many meanings. • Community has a spatial definition: • assemblages of plants and animals occurring in a particular locality and dominated by one or more prominent species or some physical characteristic • Community has a functional definition focusing on interactions: • migrations of animals and linkages between terrestrial and aquatic systems • ecological and evolutionary effects of all populations upon one another (c) 2001 by W. H. Freeman and Company
A Natural Unit of Ecological Organization? • The holistic view of communities predicts a closed community: • the distributions of species are coincident • the boundaries between communities (ecotones) are distinct • The individualistic view of communities predicts an open community: • the distributions of species are independent • the boundaries between communities are diffuse (c) 2001 by W. H. Freeman and Company
When do communities have distinct boundaries? • The concept of closed communities predicts discrete boundaries between communities: • such boundaries should be expected under two circumstances in nature: • when there is an abrupt transition in the physical environment • when one species or life form dominates strongly, such that the edge of its range determines the limits of many other species (c) 2001 by W. H. Freeman and Company
Ecotones • Ecotones represent boundaries between closed communities: • such boundaries occur when there are sharp discontinuities in the physical environment: • the interface between terrestrial and aquatic communities • the boundary between soil types with contrasting properties (such as the boundary between serpentine and nonserpentine soils) (c) 2001 by W. H. Freeman and Company
Plants contribute to conditions maintaining ecotones. • Transitions between broad-leaved and needle-leaved forests become more pronounced because of conditions created by the plants themselves: • increased soil acidity and greater accumulation of undecayed litter distinguishes the needle-leaved forest • Fire may sharpen the boundary between prairies and forests in the Midwestern U.S. • perennial grasses resist fire damage, but fires cannot penetrate deeply into forests (c) 2001 by W. H. Freeman and Company
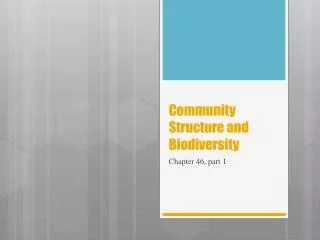
The Continuum Concept 1 • Ecotones are less likely to form along gradients of gradual environmental change: • the deciduous forest region of eastern North America does not fit the concept of the closed community: • few species have closely overlapping geographic ranges, tending to be independently distributed • sharp ecotones are not found • As ecologists sought to understand the ecology of the eastern forests, they turned to the continuum concept. (c) 2001 by W. H. Freeman and Company
The Continuum Concept 2 • The continuum concept embodies several key concepts: • plants and animals replace one another continuously along environmental gradients • species have different geographic ranges, suggesting independent evolutionary backgrounds and ecological relationships • because few species have broadly overlapping ranges, the assemblage of species found in any particular place does not represent a closed community (c) 2001 by W. H. Freeman and Company
Gradient Analysis • A gradient analysis is usually undertaken by measuring the abundances of species and physical conditions at a number of locations within a landscape: • the abundances of species are then plotted as a function of the value of any physical condition • Studies by R.H. Whittaker in the Great Smoky Mountains revealed few cases of distinct ecotones between associations of species: • species were distributed more or less independently over ranges of ecological conditions, with few cases of consistent association between species (c) 2001 by W. H. Freeman and Company
Feeding relationships organize communities in food webs. • From an ecosystem perspective, species are usually combined into relatively few trophic levels: • a food web analysis emphasizes the diversity of feeding relationships within an ecosystem: • food web analysis thus has greater potential to differentiate community structure • however, community structure is difficult to define, so different analyses may produce different results (c) 2001 by W. H. Freeman and Company
Does food web complexity lead to increased community stability? • Food web complexity should lead to stability: • when consumers have alternative resources, their populations depend less on fluctuations in any one resource • where energy can take many routes through the ecosystem, disruption of one pathway shunts more energy through another • But more diverse communities with many food web links may create pervasive, destabilizing time lags in population processes! (c) 2001 by W. H. Freeman and Company
How does food web structure affect community stability? • Robert Paine and others who have studied food webs in natural communities have stressed the importance of consumer-resource relationships in community organization: • populations of keystone predators are particularly important in maintaining community stability and diversity (c) 2001 by W. H. Freeman and Company
There are different ways to portray food webs. • Connectedness webs emphasize feeding relationships as links in a food web. • Energy flow webs represent an ecosystem viewpoint, in which connections between species are quantified by flux of energy. • Functional webs emphasize the importance of each population through its influence on growth rates of other populations. (c) 2001 by W. H. Freeman and Company
How does food web structure affect community stability? • Is one particular arrangement of feeding relationships more stable than another? • How important is food web stability to the structure of natural communities? • These questions have proven difficult to answer: • natural food webs vary tremendously, but each has persisted over long periods of time • perhaps the rules governing community structure depend on particular circumstances of each system (c) 2001 by W. H. Freeman and Company
Generalizations emerge from food web studies. • Communities may be characterized by the number of species (richness) and number of feeding links per species: • the number of feeding links per species is independent of the species richness of the community • the number of trophic levels and the number of guilds per trophic level increase with community diversity (c) 2001 by W. H. Freeman and Company
Trophic levels are influenced by predation and production. • Alternative views of the effects of various trophic levels upon one another emphasize either top-down control or bottom-up control: • Hairston, Smith, and Slobodkin argued in 1960 that the “earth is green” because carnivores depress the populations of herbivores that would otherwise consume most of the vegetation: • this is a top-down perspective emphasizing a trophic cascade (c) 2001 by W. H. Freeman and Company
Top-Down versus Bottom-Up Control • Ecologists have debated the relative strengths of top-down versus bottom-up control mechanisms: • is the earth green because plants resist consumption through various digestion inhibitors and toxic substances? • studies in lakes find evidence for both top-down and bottom-up control of community structure: • primary production generally determines the sizes of higher trophic levels (bottom-up control), but top-down interactions adjust these sizes within a narrower range (c) 2001 by W. H. Freeman and Company
Species vary in relative abundance. • One of the important differences among species within communities is their relative abundance: • in most communities, a few species achieve dominance while most are rare, represented by relatively few individuals • ecologists have portrayed relative abundances in rank-order graphs, which reveal interesting patterns: • although such patterns have been modeled, such models have been most valuable as descriptive tools rather than elucidating processes that determine relative abundance (c) 2001 by W. H. Freeman and Company
Number of species increases with area sampled. • Arrhenius first formalized the species-area relationship as: S = cAz where: S = number of species encountered A = area c and z are fitted constants • After log transformation, the relationship is linear: logS = logc + zlogA (c) 2001 by W. H. Freeman and Company
Species-Area Relationships • Analyses of many species-area relationships have shown that values of the slope, z, fall within the range 0.20 - 0.35. • Are species-area relationships artifacts of larger sample size (more individuals) in larger areas? • comparisons of species numbers in different areas where samples of similar size were used still reveals a species-area relationship (c) 2001 by W. H. Freeman and Company
Predictable Species-Area Relationships • Slopes of species-area curves vary in predictable ways: • z-values are less for continental areas, greater for islands: • rapid movement of individuals within continental areas prevents local extinction within small areas (c) 2001 by W. H. Freeman and Company
Why do larger areas have more species? • Larger areas have greater habitat heterogeneity. • For islands, size per se makes the island a better target for potential immigrants from the mainland. • Larger islands support larger populations, which persist because they have: • greater genetic diversity • broader distributions over habitats • numbers large enough to prevent stochastic extinction (c) 2001 by W. H. Freeman and Company
Diversity Indices • Although species richness is a useful measure of biological diversity, it also has certain problems: • the number of species encountered varies with the number of individuals inventoried • species differ in abundance and thus in their functional roles in communities • Diversity indices have addressed the second of these problems by weighting species by their relative abundance... (c) 2001 by W. H. Freeman and Company
Common Diversity Indices • Simpson’s index is: D = 1/pi2 where: pi = the proportion of each species in the total sample • Shannon-Wiener index is: H = - pilogepi (c) 2001 by W. H. Freeman and Company
Properties of Diversity Indices • Simpson’s index, D, can vary from 1 to S, the number of species in a sample: • larger values of S indicate greater diversity • when all species have equal abundances, D = S • when species have unequal abundances, D < S • rare species contribute less to the index than common ones • The Shannon-Wiener index, like Simpson’s, takes on larger values with greater diversity: • expressing Shannon-Wiener as eH scales the index to the number of species, making it more comparable to Simpson’s (c) 2001 by W. H. Freeman and Company
Rarefaction • Richness values from samples of unequal size cannot be compared: • rarefaction allows for comparisons, using a statistical procedure in which equal-sized subsamples are drawn at random from the total sample: • this portrays relationship of richness to sample size • rarefaction was used by Howard Sanders to compare samples of benthic organisms (c) 2001 by W. H. Freeman and Company
Summary 1 • A biological community is an association of interacting species. • Ecologists consider community diversity and organization of species into guilds and food webs. • Two competing concepts of community organization are holistic and individualistic, predicting closed and open communities, respectively. (c) 2001 by W. H. Freeman and Company
Summary 2 • In general, ecologists find that communities do not form discrete units. Species tend to distribute themselves independently along environmental gradients in a pattern more consistent with the open community concept. • Ecologists have devised techniques of gradient analysis to study distributions of species with respect to gradients of environmental conditions. (c) 2001 by W. H. Freeman and Company
Summary 3 • Community structure can be summarized by means of food webs that emphasize various relationships among species. • Consumers can depress abundances in trophic levels below them in a trophic cascade or top-down effect. Bottom-up effects occur when one trophic level affects productivity of higher trophic levels. (c) 2001 by W. H. Freeman and Company
Summary 4 • In any community, some species are common and some are rare. Patterns of relative abundance have been characterized, but their meanings are poorly understood. • The number of species increases with the area sampled, more strongly so on islands. • Various indices of diversity have been used to compare the number and relative abundances of species between communities. (c) 2001 by W. H. Freeman and Company