Download
1 / 37
370 likes | 547 Vues
Center of Ocean-Land-Atmosphere studies. CLIM 759: Topics in Climate Dynamics GEOG 670: Applied Climatology. Physical Science Basis of Climate Change : IPCC 2007. Chapter 9: Understanding and Attributing Climate Change. Jagadish Shukla. Apr 29, 2008.

E N D
Center of Ocean-Land-Atmosphere studies CLIM759: Topics in Climate Dynamics GEOG 670: Applied Climatology Physical Science Basis of Climate Change: IPCC 2007 Chapter 9: Understanding and Attributing Climate Change Jagadish Shukla Apr 29, 2008
Center of Ocean-Land-Atmosphere studies The Knowns (Observed) • CO2 emissions have grown by 80% between 1970 and 2004. • (2005: 379 ppm; All GHG: 455 ppm (CO2 equivalent); • Primary reason: fossil fuel use and land-use change) • Rate of increase of CO2, CH4, N2O was the largest in 10,000 years. • Aerosols have partly offset the warming by CO2. • Global mean surface temp. increase (linear trend) 0.76oC in 100 years (1906-2005). • Eleven of the past twelve years are the warmest on record. • In the past 500 years, the warmest 50 years were 1951-2000.
Center of Ocean-Land-Atmosphere studies The Knowns (Observed) • Sea level has risen 1.8 mm/yr since 1961; 3.1 mm/yr since 1993. • Arctic sea ice extent reduced by 2.7% per decade since 1978. • (The summer minimum on record; 2007) • Enhanced run-off and earlier spring peak discharge in many glaciers and snow-fed rivers. • Extreme hot nights have increased ; frost days have decreased. • Earlier timing of spring events (blooms) on land. • Poleward and upward shifts in plant and animal ranges. • Changes in algal, plankton, and fish abundances (~Temp.). • Increase in the acidity of oceans.
Center of Ocean-Land-Atmosphere studies LAST CENTURY OR SO …
Center of Ocean-Land-Atmosphere studies What’s Happening in the Upper Atmosphere?
Can Individual Extreme Events be Explained by Greenhouse Warming? FAQ 9.1, Figure 1. Summer temperatures in Switzerland from 1864 to 2003 are, on average, about 17°C, as shown by the green curve. During the extremely hot summer of 2003, average temperatures exceeded 22°C, as indicated by the red bar (a vertical line is shown for each year in the 137-year record). The fitted Gaussian distribution is indicated in green. The years 1909, 1947 and 2003 are labelled because they represent extreme years in the record. The values in the lower left corner indicate the standard deviation (σ) and the 2003 anomaly normalised by the 1864 to 2000 standard deviation (T’/σ). From Schär et al. (2004).
Center of Ocean-Land-Atmosphere studies Changes in Greenhouse Gases From Ice Age to Modern Data
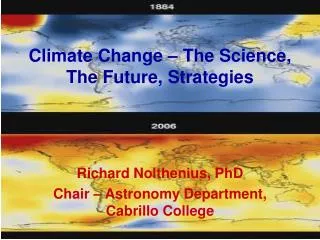
Center of Ocean-Land-Atmosphere studies Solar Irrandiance Recent analyses of satellite measurements do not indicate a long-term trend in solar irradiance (the amount of energy received by the sun), Frohlich and Lean (2005)
Center of Ocean-Land-Atmosphere studies The Knowns (Models) • Limits of deterministic prediction • (attribution of an event (Katrina) is not possible) • No model can explain the past 50 year observed global warming without increase in the green house gases (GHG). • Sun and volcanoes would have produced cooling. • There is no mechanism known to scientists that can explain the global structure of warming in the A, O, L without GHG. • Warming and sea level rise would continue for centuries, even if GHG were stabilized. • Increase in the frequency of heat waves and heavy precipitation. • Entire disappearance of arctic late summer sea ice ( ~ 2100 ).
What is a Climate Model? • Equations of motions and laws of thermodynamics to predict rate of change of: • T, P, V, q, etc. (A, O, L, CO2, etc.) • 10 Million Equations: • 100,000 Points × 100 Levels × 10 Variables • With Time Steps of:~ 10 Minutes • Use Supercomputers
Global mean, volume mean ocean temperature Courtesy of Tom Delworth (GFDL) GFDL Model Simulations
Courtesy of John Church CSIRO Marine & Atmospheric Research Hobart, Tasmania, Australia Report of the WCRP Workshop (163 participants, 29 nations) Thank you!
Climate models without volcanic Forcing Domingues et al. 2008
Climate models withvolcanic Forcing (0-700 m) ThSL: Thermosteric sea level change (density changes induced by temperature change)
Understanding and Attributing Climate Change Center of Ocean-Land-Atmosphere studies • 1. Equilibrium Climate Sensitivity (ECS) and Transient Climate Response (TCR) • Definitions • Model ECS and TCR—the role of feedbacks • 2. Detection and Attribution • Detection and Attribution of What? • Modeling with and without anthropogenic forcing • 3. Understanding?
Equilibrium Climate Sensitivity (ECS) and Transient Climate Response (TCR) Center of Ocean-Land-Atmosphere studies • Definition: The ECS is the full equilibrium surface temperature response to a doubling of CO2 • Definition: The TCR is the surface temperature response at CO2 doubling for a 1%/yr increase of CO2 (i.e. at year 70) • a. ECS and TCR are basically model concepts • b. TCR < ECS • c. ECS is a measure of the feedbacks in the system: • Recall:
Simple Climate Model (1) Center of Ocean-Land-Atmosphere studies • Solar Radiation Energy Input (SRE) = Outgoing Terrestrial Radiation Energy (TRE) • π r2 So (1-α) = 4πr2 σTe4 • [So (1-α)] / 4 = σ Te4 = S • Te = (S/ σ)1/4 = 255oK • Actual surface Ts = 288oK (15oC) • Te is ~ temperature at 6 Km (lapse rate ~ 5.5 oC/Km) • r = radius of Earth • πr2 = area of ‘Earth disc’ • α = albedo (0.3) • Te = effective radiating temperature of Earth • So = Solar irradiance = 1367 Wm-2 • S = mean flux of absorbed solar radiation per unit area = 239 Wm-2 • σ = Stefan-Boltzman Constant (5.67x10⁻⁸ Wm-2K-4 )
Simple Climate Model (2) Center of Ocean-Land-Atmosphere studies [So (1-α)] / 4 = σ Te4 = S dTe / Te = ¼ dSo/So = ¼ dS/S dTe/dSo = Te/4So (Assuming α is constant) If So increase by a small percentage β, Te will increase by a percentage ¼ β (If So increase by 2 percent ; Te will increase by ½ percent) If there were no feedback in the system, surface temperature (TS) will increase by same amount as Te. But that is not the case because of feedbacks.
Simple Climate Model (3) Center of Ocean-Land-Atmosphere studies Define ΔTo as change in temperature without feedbacks, ΔTs is the actual change in Earth surface temperature. Define a feedback factor, f such that f is equal to : ΔTs / ΔTo ΔTs= fΔTo =ΔTo+ ΔTfeedabck Divide by ΔTs ; ΔTs/ ΔTs = ΔTo/ΔTs + ΔTfeedabck/ ΔTs Define gain g is equal to : ΔTfeedabck/ ΔTs = g (gain) 1=1/f +g ; f = [1-g] -1 But suppose there are many feedbacks, then have gi = ΔTfeedabck i / ΔTs ; i=1,2,3,… g=g1+g2+g3+…. ΔTs = fΔTo ; f = (1- Σ gi) -1 = [1-(g1+g2+g3+…)]-1
Simple Climate Model (4) Center of Ocean-Land-Atmosphere studies Models show: g1 (water vapor / lapse rate) = 0.4 g2 (snow/ice albedo) = 0.1 ΔTo is change in temperature without feedbacks. ΔTo = 1.2 oC (for doubling of CO2 Radiative forcing of 4 W/m2 and No feedback) For climate models: g = 0.6 ; f = (1-0.6)-1 = (0.4)-1 = 2.5 So, ΔTs = 2.5 (ΔTo) = 2.5 (1.2) = 3oC (Please note aerosols are forcing not feedback.)
Quasi-linear Dependence between Outgoing Longwave Radiation and Surface Temperature for Seasonal Cycle Center of Ocean-Land-Atmosphere studies Despite a factor 2 difference in seasonal temperature ranges for NH and SH, climate sensitivity is nearly equal (0.56 oK/Wm-2). λ (no feedback) = 0.3 oK/Wm-2 λ (GCM, fdbk) = 0.75 oK/Wm-2 Climate sensitivity : Ratio between mean surface warming (ΔToC) and corresponding increment (Δ F Watt/m2) in OLR at tropopause. Lecture by P. Morel, at European Geoscience Union in Vienne, Apr. 2008
Equilibrium Climate Sensitivity (ECS) for Anthropogenic Climate Change Center of Ocean-Land-Atmosphere studies • ECS: The equilibrium change in the annual mean global surface temperature following doubling of the atmospheric equivalent carbon dioxide (CO2) concentration. • ECS for TAR: 1.5oC to 4.5oC • ECS for AR4: 3oC • Based on observational constraint: the most likely valuebetween 2°C and 3°C. • Based onAR4 AOGCMs: the most likely valuebetween 2.1°C to4.4°C, mean value 3.3°C. • Based on observations and models: in the range of 2°C to 4.5°C, with a most likely value of about3°C.
Equilibrium Climate Sensitivity (ECS) and Transient Climate Response (TCR) Center of Ocean-Land-Atmosphere studies • d. Climate model sensitivity is usually gotten by coupling to a mixed layer model with mean heat transport specified as a Q-flux and then doubling CO2 [initial condition matters]. • This assumes that the ocean heat transport doesn’t change. • The TCR scales with the ECS-depends on ocean heat uptake. Figure 10.25. (a) TCR versus equilibrium climate sensitivity for all AOGCMs (red), EMICs (blue), a perturbed physics ensemble of the UKMO-HadCM3 AOGCM (green; an updated ensemble based on M. Collins et al., 2006) and from a large ensemble of the Bern2.5D EMIC (Knutti et al., 2005) using different ocean vertical diffusivities and mixing parametrizations (grey lines).
Equilibrium Climate Sensitivity (ECS) and Transient Climate Response (TCR) Center of Ocean-Land-Atmosphere studies • There are uncertainties in observations and RF and, even if known, ECS still depends on models. • The models used are usually simpler models (EBMs or EMICs).
Figure 9.21. Probability distributions of TCR (expressed as warming at the time of CO2 doubling), as constrained by observed 20th-century temperature change, for the HadCM3 (Table 8.1, red), PCM (Table 8.1, green) and GFDL R30 (Delworth et al., 2002, blue) models. The average of the PDFs derived from each model is shown in turquoise. Coloured circles show each model’s TCR. (After Stott et al., 2006c).
Center of Ocean-Land-Atmosphere studies Global and Continental Temperature Change Comparison of observed continental- and global-scale changes in surface temperature with results simulated by climate models using natural and anthropogenic forcings. Decadal averages of observations are shown for he period 1906-2005 (black line) plotted against the centre of the decade and relative to the corresponding average for 1901-1950. Lines are dashed where spatial coverage is less than 50 %. Blue shaded bands show the 5-95% range for 19 simulates form 5 climate models using only the natural forcings due to solar activity and volcanoes. Red shaded bands show the 5-95% range for 58 simulations from 14 climate models using both natural and anthropogenic forcings.
Center of Ocean-Land-Atmosphere studies Mean of 15 Models Surface Air Temperature Difference (Sresa1b YR 71-100) minus (20c3m 1969-98), Global Average = 2.61
Center of Ocean-Land-Atmosphere studies 1.0º C Courtesy of UCAR
Center of Ocean-Land-Atmosphere studies Mean of 15 Models Surface Air Temperature Difference (Sresa1b YR 71-100) minus (20c3m 1969-98), Global Average = 2.61
Center of Ocean-Land-Atmosphere studies Climate Model Fidelity and Projections of Climate Change J. Shukla, T. DelSole, M. Fennessy, J. Kinter and D. Paolino Geophys. Research Letters, 33, doi10.1029/2005GL025579, 2006
Center of Ocean-Land-Atmosphere studies THANK YOU! ANY QUESTIONS?