Download
1 / 55
550 likes | 579 Vues
Explore current ocean monitoring insights highlighting changes in Pacific/Arctic, Indian, & Atlantic Oceans. Detailed SST observations & predictions, ENSO conditions, & hurricane forecasts. Track anomalies & tendencies for informed analysis.

E N D
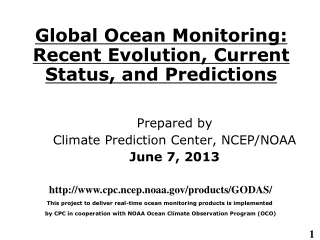
Global Ocean Monitoring: Recent Evolution, Current Status, and Predictions Prepared by Climate Prediction Center, NCEP/NOAA June 7, 2013 http://www.cpc.ncep.noaa.gov/products/GODAS/ This project to deliver real-time ocean monitoring products is implemented by CPC in cooperation with NOAA Ocean Climate Observation Program (OCO)
Outline • Overview • Recent highlights • Pacific/Arctic Ocean (NOAA 2013 E. Pacific hurricane prediction) • Indian Ocean • Atlantic Ocean (NOAA 2013 Atlantic hurricane prediction) • Global SST Predictions
Overview • Pacific and Arctic Oceans • ENSO-neutral condition continued during May 2013 and cooling tendency was strengthened in the eastern Pacific with Nino3.4=-0.3C. • NOAA officially forecast ENSO-neutral condition to continue in the Northern Hemisphere summer 2013. • Negative PDO phase weakened since Apr 2013 and PDO index =-0.6 in May 2013, and NCEP CFSv2 predicted negative phase of PDO will continue. • Arctic sea ice extent in May 2013 was below-normal. • Indian Ocean • SSTs were above in the east and slightly blow-normal in the west, and negative dipole index was strengthened in May 2013. • Atlantic Ocean • NAO switched from negative to positive phase in Apr 2013 and NAO index =0.6 in May 2013. • SSTs were above-normal in the tropical North Atlantic main hurricane development region in May 2013.
Global SST Anomaly (0C) and Anomaly Tendency • Negative SSTA presented in the e. Pacific. • Negative phase PDO associated SSTA pattern continued in N. Pacific. • Positive SSTA was observed in the e. Indian and w. Pacific Oceans. • Tripolar SSTA presented in N. Atlantic. • Cooling tendency presented in the equatorial e. Pacific. • Weakening tendency of negative phase of PDO associated SSTA was observed in N. Pacific. • Cooling (warming) tendency was seen in the w. (e.) tropical N. Atlantic. • An overall cooling tendency was observed in the tropical Indian Ocean. Fig. G1. Sea surface temperature anomalies (top) and anomaly tendency (bottom). Data are derived from the NCEP OI SST analysis, and anomalies are departures from the 1981-2010 base period means.
Global SSH Anomaly (cm) and Anomaly Tendency • The SSH anomalies were overall consistent with SSTA for large-scale pattern: • Positive (negative) SSTA is tied up with positive (negative) SSH anomaly.
Longitude-Depth Temperature Anomaly and Anomaly Tendency in 2OS-2ON Fig. G3. Equatorial depth-longitude section of ocean temperature anomalies (top) and anomaly tendency (bottom). Data are derived from the NCEP's global ocean data assimilation system which assimilates oceanic observations into an oceanic GCM. Anomalies are departures from the 1981-2010 base period means. • Positive (negative) temperature anomalies occupied around the thermocline in the w. (e.) Pacific Ocean, suggesting an intensified w-e contrast. • Positive anomalies around the thermocline occurred in the Atlantic and Indian Oceans. • Warming (cooling) tendency was observed in the w. (e.) Pacific around the thermocline, and warming tendency was seen in both e. and w. coasts. • Obvious warming tendency around the thermocline was noted the Indian Ocean. • Both positive and negative tendency presented in Atlantic Ocean.
Positive TCHP anomalies presented in the w. Pacific and negative ones in the c. and e. Pacific. • Positive anomalies were observed over the w. Atlantic Ocean. • The tendency was small in both the tropical N. Atlantic and E. tropical Pacific. TCHP field is the anomalous heat storage associated with temperatures larger than 26°C.
NOAA Predict an Above-Normal Atlantic Hurricane Season in 2013 (http://www.cpc.ncep.noaa.gov/products/outlooks/hurricane.shtml http://en.wikipedia.org/wiki/Accumulated_cyclone_energy) • The ongoing set of atmospheric and oceanic conditions include: • An expected continuation of above-average sea surface temperatures (SSTs) across the tropical Atlantic Ocean and Caribbean Sea, that have been producing increased Atlantic hurricane activity since 1995; • A likely continuation of ENSO-neutral conditions in 2013 (i.e., no El Niño or La Niña); meaning El Niño is not expected to develop and suppress the hurricane season.
AMO is a major factors for Atlantic hurricane Forecast • AMO was above normal since around 1995.
NOAA Predict a Below-Normal E. Pacific Hurricane Season in 2013 (http://en.wikipedia.org/wiki/2013_Pacific_hurricane_season http://en.wikipedia.org/wiki/Accumulated_cyclone_energy) • The ongoing climate conditions include: • Expected ENSO-neutral conditions in 2013, meaning El Niño is not expected to develop and strengthen the seasonal activity; • Expected near-average or below-average sea-surface temperatures in the eastern equatorial Pacific Ocean.
GODAS-TAO TAO Pentad Mean Equatorial Pacific Temperature Anomaly • Positive temperature anomalies in the c. and w. Pacific persisted and did not have clear propagation. • Negative temperature anomalies in the c. and e. Pacific also did not have clear propagation. • However, the differences between TAO and GODAS were still large in the c. and e. Pacific (150W, 120W). What causes the differences?
TAO GODAS CFSR Last 3-Month Mean Equatorial Pacific Temperature Anomaly • The monthly mean differences between TAO and GODAS, and between TAO and CFSR were also large in the c. and e. Pacific. • What causes the differences?
Status of TAO/TRITON Data Delivery http://www.ndbc.noaa.gov http://www.pmel.noaa.gov/tao/jsdisplay/ Beginning of May 2013 Beginning of June 2013 • The TAO/TRITON array has encountered significant outages in before Apr 2013, particularly in the eastern part of the array. • However, some of the arrays were repaired and the data were available since Apr 2013. Beginning of Apr 2013
NINO3.4 Heat Budget • SSTA tendency (dT/dt) in NINO3.4 region (dotted black line) was near zero in May 2013. • All the advection terms were small since mid-Jan 2013. • The thermodynamical term (Qq) were positive most time in May 2013. • The RHS and dT/dt had large differences during Mar-May 2013. Huang, B., Y. Xue, X. Zhang, A. Kumar, and M. J. McPhaden, 2010 : The NCEP GODAS ocean analysis of the tropical Pacific mixed layer heat budget on seasonal to interannual time scales, J. Climate., 23, 4901-4925. Qu: Zonal advection; Qv: Meridional advection; Qw: Vertical entrainment; Qzz: Vertical diffusion Qq: (Qnet - Qpen + Qcorr)/ρcph; Qnet = SW + LW + LH +SH; Qpen: SW penetration; Qcorr: Flux correction due to relaxation to OI SST
Evolution of Equatorial Pacific Surface Zonal Current Anomaly (cm/s) • Since Feb 2013, eastward anomaly current was observed, and weakened since Apr 2013. • Some detailed differences were noted for both anomaly and climatology between OSCAR and GODAS.
Oceanic Kelvin Wave Indices • Since Mar 2013, Kelvin wave –like propagation was less evident, and almost stationary variation is consistent with the pentad ocean temperature anomaly shown in slide 12. • Oceanic Kelvin wave indices are defined as standardized projections of total anomalies onto the 14 patterns of Extended EOF 1 of equatorial temperature anomalies (Seo and Xue , GRL, 2005).
Evolution of Pacific NINO SST Indices • All Nino indices were negative: Nino1+2=-1.4C, Nino3=-0.7C, NINO 3.4=-0.3oC. • The indices were calculated based on OISST. They may have some differences compared with those based on ERSST.v3b. Fig. P1a. Nino region indices, calculated as the area-averaged monthly mean sea surface temperature anomalies (oC) for the specified region. Data are derived from the NCEP OI SST analysis, and anomalies are departures from the 1981-2010 (bar) and last ten year (green line) means.
Equatorial Pacific SST (ºC), HC300 (ºC), u850 (m/s) and OLR(W/m2 )Anomalies CPC MJO Indices http://www.cpc.ncep.noaa.gov/products/precip/CWlink/daily_mjo_index/mjo_index.shtml Fig. P4. Time-longitude section of anomalous pentad sea surface temperature (left), upper 300m temperature average (heat content, middle-left), 850-mb zonal wind (U850, middle-right) averaged in 2OS-2ON and Outgoing Long-wave Radiation (OLR, right) averaged in 5OS-5ON. SST is derived from the NCEP OI SST, heat content from the NCEP's global ocean data assimilation system, U850 from the NCEP CDAS. Anomalies for SST, heat content and U850/OLR are departures from the 1981-2010 base period pentad means respectively.
Tropical Pacific: SST Anom., SST Anom. Tend., OLR, Sfc Rad, Sfc Flx, 925-mb & 200-mb Winds • The suppressed (enhanced) convection near the Dateline (over the Maritime Continent) , low level (upper level) easterly (westerly) wind anomalies in the western-central Pacific are consistent with La Nina-like conditions. Fig. P2. Sea surface temperature (SST) anomalies (top-left), anomaly tendency (top-right), Outgoing Long-wave Radiation (OLR) anomalies (middle-left), sum of net surface short- and long-wave radiation, latent and sensible heat flux anomalies (middle-right), 925-mb wind anomaly vector and its amplitude (bottom-left), 200-mb wind anomaly vector and its amplitude (bottom-right). SST are derived from the NCEP OI SST analysis, OLR from the NOAA 18 AVHRR IR window channel measurements by NESDIS, winds and surface radiation and heat fluxes from the NCEP CDAS. Anomalies are departures from the 1981-2010 base period means.
Pacific Decadal Oscillation Index • Negative PDO phase since May 2010 has persisted for more than 3 years (37 months) now, and the PDO index weakened since Apr 2013 and PDO index=-0.6 in May 2013. • The apparent connection between Nino3.4 and PDO indices suggests connections between tropics and extra-tropics. • However, the negative phase of PDO during Jun-Nov 2012 seems not connected with the positive Nino3.4 SSTA. • Pacific Decadal Oscillation is defined as the 1st EOF of monthly ERSST v3b in the North Pacific for the period 1900-1993. PDO index is the standardized projection of the monthly SST anomalies onto the 1st EOF pattern. • The PDO index differs slightly from that of JISAO, which uses a blend of UKMET and OIv1 and OIv2 SST.
Last Three Month SST, SLP and 925hp Wind Anom. • Negative phase of PDO associated SSTA persisted and the positive SSTA propagated eastward. • Both wind and SLP anomalies were small in N. Pacific in May 2013.
NorthAmerica Western Coastal Upwelling • Both downwelling in high latitudes (50-57N) and upwelling in low latitudes (24-48N) were suppressed in May 2013. Fig. NP2. Total (top) and anomalous (bottom) upwelling indices at the 15 standard locations for the western coast of North America. Upwelling indices are derived from the vertical velocity of the NCEP's global ocean data assimilation system, and are calculated as integrated vertical volume transport at 50 meter depth from each location to its nearest coast point (m3/s/100m coastline). Anomalies are departures from the 1981-2010 base period pentad means. • Area below (above) black line indicates climatological upwelling (downwelling) season. • Climatologically upwelling season progresses from March to July along the west coast of North America from 36ºN to 57ºN.
Arctic Sea Ice http://nsidc.org/arcticseaicenews/index.html. • Averaged sea ice extent for May 2013 was still below-normal, and it is similar to May 2012.
Evolution of Indian Ocean SST Indices • DMI was negative since Apr 2013, consistent with above (below) normal in the e. (w.) Indian Ocean. • Negative DMI was intensified in May 2013. Fig. I1a. Indian Ocean Dipole region indices, calculated as the area-averaged monthly mean sea surface temperature anomalies (OC) for the SETIO [90ºE-110ºE, 10ºS-0] and WTIO [50ºE-70ºE, 10ºS-10ºN] regions, and Dipole Mode Index, defined as differences between WTIO and SETIO. Data are derived from the NCEP OI SST analysis, and departures from the 1981-2010 base period means and the recent 10 year means are shown in bars and green lines.
Evolution of Tropical Atlantic SST Indices Fig. A1a. Tropical Atlantic Variability region indices, calculated as the area-averaged monthly mean sea surface temperature anomalies (ºC) for the TNA [60ºW-30ºW, 5ºN-20ºN], TSA [30ºW-10ºE, 20ºS-0] and ATL3 [20ºW-0, 2.5ºS-2.5ºN] regions, and Meridional Gradient Index, defined as differences between TNA and TSA. Data are derived from the NCEP OI SST analysis, and departures from the 1981-2010 base period means and the recent 10 year means are shown in bars and green lines. • Basin-wide SST was above-normal in May 2013. • SSTA in the tropical N. Atlantic (TNA) was positive since May 2012. • Meridional Gradient Mode index (TNA-TSA) was positive since May 2011. • ATL3 SSTA was positive since Aug 2012.
Tropical Atlantic: • Above-normal SST presented in the hurricane Main Development Region (MDR). • The vertical wind shear was below-normal in the hurricane Main Development Region, favorable for hurricane activities. • Cooling tendency was observed in the western Atlantic and Gulf of Mexico. • Both suppressed and enhanced convection was observed in the tropical N. Atlantic. • TCHP was positive and mainly in the NW Atlantic Ocean.
NAO and SST Anomaly in North Atlantic • NAO switched from negative to positive phase in Apr 2013, with NAO index = 0.6 in May 2013. That may not favor the positive SSTA in the tropical N. Atlantic. • The zonal mean SSTA in North Atlantic is generally related to NAO and ENSO impact (Hu et al. 2011: J. Climate, 24(22)). Fig. NA2. Monthly standardized NAO index (top) derived from monthly standardized 500-mb height anomalies obtained from the NCEP CDAS in 20ºN-90ºN (http://www.cpc.ncep.noaa.gov). Time-Latitude section of SST anomalies averaged between 80ºW and 20ºW (bottom). SST are derived from the NCEP OI SST analysis, and anomalies are departures from the 1981-2010 base period means.
North Atlantic: SST Anom., SST Anom. Tend., OLR, SLP, Sfc Rad, Sfc Flx • Positive SLP anomaly in the south and negative in the northeast was consistent with the positive NAO index in May 2013. Fig. NA1. Sea surface temperature (SST) anomalies (top-left), anomaly tendency (top-right), Outgoing Long-wave Radiation (OLR) anomalies (middle-left), sea surface pressure anomalies (middle-right), sum of net surface short- and long-wave radiation anomalies (bottom-left), sum of latent and sensible heat flux anomalies (bottom-right). SST are derived from the NCEP OI SST analysis, OLR from the NOAA 18 AVHRR IR window channel measurements by NESDIS, sea surface pressure and surface radiation and heat fluxes from the NCEP CDAS. Anomalies are departures from the 1979-1995 base period means except SST anomalies are computed with respect to the 1971-2000 base period means.
IRI/CPC NINO3.4 Forecast Plume • Majority of the models predicted ENSO-neutral in the Northern Hemisphere summer-winter. • Average of forecast Nino3.4 of dynamical models were warmer than that of statistical models. • The consensus forecast favors ENSO-neutral conditions in the summer-autumn 2013.
NCEP CFSv2 NINO3.4 Forecast • The Nino3.4 predictions of CFSv2 shifted from positive SSTA in summer-autumn with IC in Feb 2013 to negative with IC in Mar 2013, near normal with IC in Apr 2013, then positive again with IC in May 2013, may imply the impact of short-term fluctuation and challenge of ENSO prediction with IC in spring. • (Wang, W., M. Chen, A. Kumar, and Y. Xue, 2011: How important is intraseasonal surface wind variability to real-time ENSO prediction? Geophys. Res. Lett., 38, L13705. DOI: 10.1029/2011GL047684.)
Individual Models: diverged results JMA: Nino3, IC=May2013 (near normal) ECMWF: Nino3, IC=01May2013 (large spread) UKMO: Nino3.4, IC=15May2013 (near normal) Australia: Nino3.4, IC=02May2013 ( u-type)
NCEP CFSv2 Pacific Decadal Oscillation (PDO) Forecast PDO is the first EOF of monthly ERSSTv3b anomaly in the region of [110oE-100oW, 20oN-60oN]. CFS PDO index is the standardized projection of CFS SST forecast anomalies onto the PDO EOF pattern. - Latest CFSv2 prediction suggests negative phase of PDO will persist through the coming summer and autumn.
NCEP CFSv2 Tropical North Atlantic SST Forecast • Latest CFSv2 prediction suggests that above-normal SST in the tropical N. Atlantic will continue in summer-autumn 2013 (hurricane season).
Equatorial subsurface ocean temperature monitoring: Right now, in recharge phase; recharge/discharge were weak in last 2 years. Projection of OTA onto EOF1 and EOF2 (2S-2N, 0-459m, 1979-2010) EOF1: Tilt mode (ENSO peak phase); EOF2: WWV mode, Recharge/discharge oscillation (ENSO transition phase). Recharge process: heat transport from outside of equator to equator : Negative -> positive phase of ENSO Discharge process: heat transport from equator to outside of equator: Positive -> Negative phase of ENSO For details, see: Kumar, A. and Z.-Z. Hu, 2013: Interannual and interdecadal variability of ocean temperature along the equatorial Pacific in conjunction with ENSO. Clim. Dyn. DOI: 10.1007/s00382-013-1721-0 (published online).
Warm Water Volume (WWV) and NINO3.4 Anomalies Fig. P3. Phase diagram of Warm Water Volume (WWV) and NINO 3.4 SST anomalies. WWV is the average of depth of 20ºC in [120ºE-80ºW, 5ºS-5ºN] calculated with the NCEP's global ocean data assimilation system. Anomalies are departures from the 1981-2010 base period means. • WWV is defined as average of depth of 20ºC in [120ºE-80ºW, 5ºS-5ºN]. Statistically, peak correlation of Nino3 with WWV occurs at 7 month lag (Meinen and McPhaden, 2000). • Since WWV is intimately linked to ENSO variability (Wyrtki 1985; Jin 1997), it is useful to monitor ENSO in a phase space of WWV and NINO3.4 (Kessler 2002). • Increase (decrease) of WWV indicates recharge (discharge) of the equatorial oceanic heat content. 2012 2013 2011
North Pacific & Arctic Ocean: SST Anom., SST Anom. Tendency, OLR, SLP, Sfc Rad, Sfc Flx Fig. NP1. Sea surface temperature (SST) anomalies (top-left), anomaly tendency (top-right), Outgoing Long-wave Radiation (OLR) anomalies (middle-left), sea surface pressure anomalies (middle-right), sum of net surface short- and long-wave radiation anomalies (bottom-left), sum of latent and sensible heat flux anomalies (bottom-right). SST are derived from the NCEP OI SST analysis, OLR from the NOAA 18 AVHRR IR window channel measurements by NESDIS, sea surface pressure and surface radiation and heat fluxes from the NCEP CDAS. Anomalies are departures from the 1981-2010 base period means.
Tropical Indian: SST Anom., SST Anom. Tend., OLR, Sfc Rad, Sfc Flx, 925-mb & 200-mb Wind Anom. Fig. I2. Sea surface temperature (SST) anomalies (top-left), anomaly tendency (top-right), Outgoing Long-wave Radiation (OLR) anomalies (middle-left), sum of net surface short- and long-wave radiation, latent and sensible heat flux anomalies (middle-right), 925-mb wind anomaly vector and its amplitude (bottom-left), 200-mb wind anomaly vector and its amplitude (bottom-right). SST are derived from the NCEP OI SST analysis, OLR from the NOAA 18 AVHRR IR window channel measurements by NESDIS, winds and surface radiation and heat fluxes from the NCEP CDAS. Anomalies are departures from the 1981-2010 base period means.
NCEP CFS DMI SST Predictions from Different Initial Months Fig. M2. CFS Dipole Model Index (DMI) SST predictions from the latest 9 initial months. Displayed are 40 forecast members (brown) made four times per day initialized from the last 10 days of the initial month (labelled as IC=MonthYear) as well as ensemble mean (blue) and observations (black). The hindcast climatology for 1981-2006 was removed, and replaced by corresponding observation climatology for the same period. Anomalies were computed with respect to the 1981-2010 base period means. DMI = WTIO- SETIO SETIO = SST anomaly in [90oE-110oE, 10oS-0] WTIO = SST anomaly in [50oE-70oE, 10oS-10oN]
Evolution of Pacific NINO SST Indices • Positive SSTA in 2012 propagated from the eastern to western Pacific. • Both Cold Tongue, Warm Pool, and ENSO-Modoki indices were slightly negative, consistent with overall small SSTA in the equatorial Pacific. • The indices were calculated based on OISST. They may have some differences compared with those based on ERSST.v3b.
Atlantic Hurricane Activity in 1958, 1998, 2005, 2010<Hu, Z.-Z., A. Kumar, B. Huang, Y. Xue, W. Wang, and B. Jha, 2011: Persistent atmospheric and oceanic anomalies in the North Atlantic from Summer 2009 to Summer 2010. J. Climate, 24(22), 5812-5830.> The 4 years that had a similar juxtaposition of a warm ENSO (decay phase) and negative phase of the NAO, i.e., 1958, 1998, 2005, and 2010 had above normal Atlantic hurricane seasons. The Atlantic Accumulated Cyclone Energy (ACE) index value in the North Atlantic (http://en.wikipedia.org/wiki/Accumulated_cyclone_energy) is 121 in 1958, 182 in 1998, 248 in 2005, and 165 in 2010. For 1950-2009, the mean of ACE is 101 and the median is 88.0. 1998 1958 2005 2010
No TAO data TAO data available • The ocean temperature anomaly differences between CFSR and GODAS are larger when TAO data are missed compared with that they are not missed. • Statistically, it seems to suggest that without constraint of TAO data, the differences become larger between GODAS and CFSR. • It seems that both the data assimilation system and data inputs may cause biases in the reanalysis data.