Download
1 / 10
100 likes | 107 Vues
Alembic Pharma Limited: Check out the institutional research report of Q4 result of Alembic Pharma Ltd. Alembic Pharma’s (ALPM) revenue grew 16%YoY to Rs 8.5bn in 4QFY18

E N D
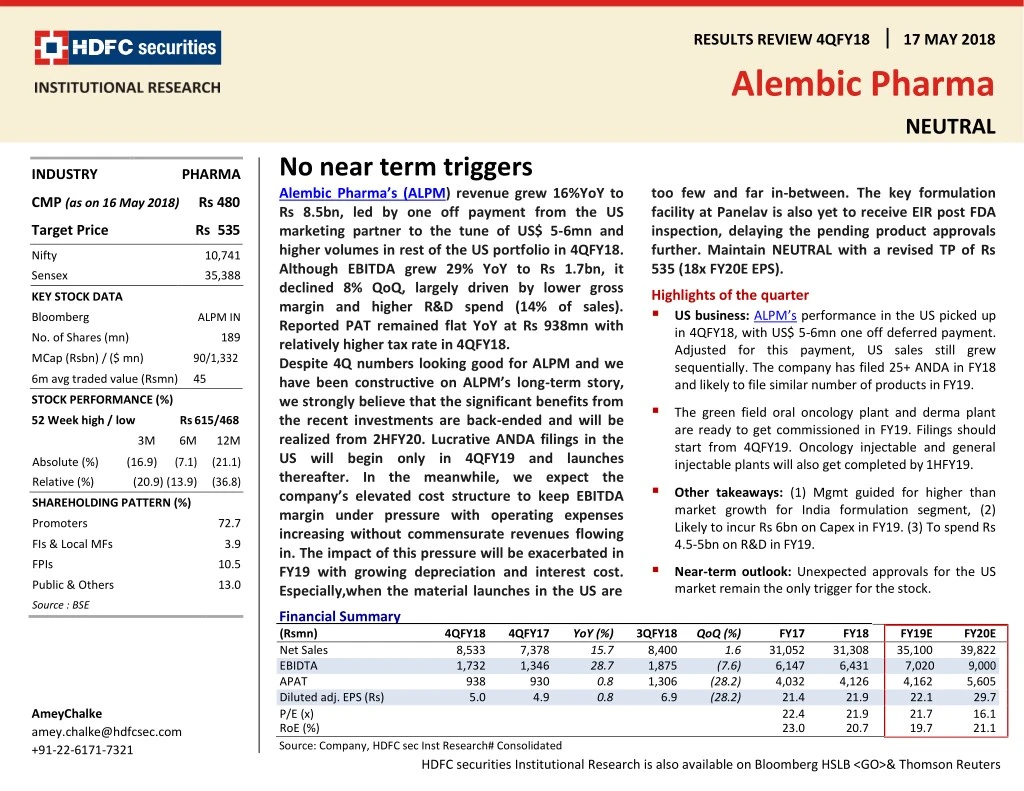
RESULTS REVIEW 4QFY18 Alembic Pharma 17 MAY 2018 NEUTRAL No near term triggers Alembic Pharma’s (ALPM) revenue grew 16%YoY to Rs 8.5bn, led by one off payment from the US marketing partner to the tune of US$ 5-6mn and higher volumes in rest of the US portfolio in 4QFY18. Although EBITDA grew 29% YoY to Rs 1.7bn, it declined 8% QoQ, largely driven by lower gross margin and higher R&D spend (14% of sales). Reported PAT remained flat YoY at Rs 938mn with relatively higher tax rate in 4QFY18. Despite 4Q numbers looking good for ALPM and we have been constructive on ALPM’s long-term story, we strongly believe that the significant benefits from the recent investments are back-ended and will be realized from 2HFY20. Lucrative ANDA filings in the US will begin only in 4QFY19 and launches thereafter. In the meanwhile, we expect the company’s elevated cost structure to keep EBITDA margin under pressure with operating expenses increasing without commensurate revenues flowing in. The impact of this pressure will be exacerbated in FY19 with growing depreciation and interest cost. Especially,when the material launches in the US are INDUSTRY PHARMA too few and far in-between. The key formulation facility at Panelav is also yet to receive EIR post FDA inspection, delaying the pending product approvals further. Maintain NEUTRAL with a revised TP of Rs 535 (18x FY20E EPS). CMP (as on 16 May 2018) Rs 480 Target Price Rs 535 Nifty 10,741 Sensex 35,388 Highlights of the quarter ▪US business: ALPM’s performance in the US picked up in 4QFY18, with US$ 5-6mn one off deferred payment. Adjusted for this payment, US sales still grew sequentially. The company has filed 25+ ANDA in FY18 and likely to file similar number of products in FY19. ▪The green field oral oncology plant and derma plant are ready to get commissioned in FY19. Filings should start from 4QFY19. Oncology injectable and general injectable plants will also get completed by 1HFY19. ▪Other takeaways: (1) Mgmt guided for higher than market growth for India formulation segment, (2) Likely to incur Rs 6bn on Capex in FY19. (3) To spend Rs 4.5-5bn on R&D in FY19. ▪Near-term outlook: Unexpected approvals for the US market remain the only trigger for the stock. KEY STOCK DATA Bloomberg ALPM IN No. of Shares (mn) 189 MCap (Rsbn) / ($ mn) 90/1,332 6m avg traded value (Rsmn) 45 STOCK PERFORMANCE (%) 52 Week high / low Rs 615/468 3M 6M 12M Absolute (%) (16.9) (7.1) (21.1) Relative (%) SHAREHOLDING PATTERN (%) (20.9) (13.9) (36.8) Promoters 72.7 FIs & Local MFs 3.9 FPIs 10.5 Public & Others 13.0 Source : BSE Financial Summary (Rsmn) Net Sales EBIDTA APAT Diluted adj. EPS (Rs) P/E (x) RoE (%) FY18 31,308 6,431 4,126 21.9 21.9 20.7 4QFY18 8,533 1,732 938 4QFY17 7,378 1,346 930 YoY (%) 15.7 28.7 3QFY18 8,400 1,875 1,306 QoQ (%) FY17 31,052 6,147 4,032 21.4 22.4 23.0 FY19E 35,100 7,020 4,162 22.1 21.7 19.7 FY20E 39,822 9,000 5,605 29.7 16.1 21.1 1.6 (7.6) (28.2) (28.2) 0.8 0.8 5.0 4.9 6.9 AmeyChalke amey.chalke@hdfcsec.com +91-22-6171-7321 Source: Company, HDFC sec Inst Research# Consolidated HDFC securities Institutional Research is also available on Bloomberg HSLB <GO>& Thomson Reuters
ALEMBIC PHARMA:RESULTS REVIEW 4QFY18 Quarterly Financials Snapshot (Consolidated) Particulars Net Sales Material Expenses 4QFY18 4QFY17 7,378 2,005 YoY (%) 3QFY18 8,400 2,264 QoQ (%) ALPM’s top line grew 16%YoY to Rs 8.5bn in 4QFY18, largely led by 29%YoY growth in international business 8,533 15.7 31.6 1.6 16.5 2,638 Employee Expenses R&D Expenses Other Expenses EBITDA 1,573 1,379 1,123 1,526 1,346 14.1 7.6 1,474 6.7 23.1 1,208 981 1,382 1,732 (9.5) 28.7 1,805 1,875 (23.5) (7.6) R&D expenses were higher at Rs 1.2bn in 4QFY8 Depreciation EBIT 316 1,417 218 264 1,128 25.6 1,611 (12.1) Other Income Interest Cost 6 9 3 8 13 18 PBT Tax 1,410 385 1,118 165 26.0 1,606 298 (12.2) Although opex has declined sequentially, we expect strong ramp up in the coming quarters. Minority Interest RPAT 87 938 23 930 3 0.8 1,306 (28.2) EO Items (Adj For Tax) Source: Company, HDFC sec Inst Research Margin Analysis - - - APAT 938 930 0.8 1,306 (28.2) ALPM is commissioning five facilities for the US market in FY19 with revenues to start coming in from 2HFY20 4QFY18 30.9 4QFY17 27.2 YoY (bps) 3QFY18 27.0 QoQ (bps) Material Expenses % Net Sales 374 396 Employee Expenses % Net Sales R&D Expenses % Net Sales Other Expenses % Net Sales EBITDA Margin (%) Tax Rate (%) 18.4 14.2 16.2 20.3 27.3 18.7 15.2 20.7 18.2 14.7 (25) (106) 17.6 11.7 21.5 22.3 18.5 88 248 (449) (530) EBITDA margin contraction was a factor of higher R&D spending 206 (202) 1,258 879 APAT Margin (%) Source: Company, HDFC sec Inst Research 11.0 12.6 (162) 15.5 (456) Page | 2
ALEMBIC PHARMA:RESULTS REVIEW 4QFY18 Revenue: Growth Aided By US Business Up-Tick Domestic Business: In-Line With Expectations Top line growth was aided by one off income in the US and growing volumes for existing products Revenue (Rs mn) YoY growth (%) Domestic formulations rev. (Rs mn) 17.2 (0.4) 3.6 3.0 3.1 YoY growth (%) 24.7 13.7 17.9 15.7 6.3 6.3 6.1 2.6 9.0 1.8 21.1 2.4 (9.5) 7.9 We expect the domestic business to grow in-line with the market in FY19 12.0) ( (13.5) (15.9) 7.7 ( ) 6.3 7.3 7.4 8.4 6.4 8.7 8.5 2.7 2.9 3.9 3.5 3.0 4QFY16 1QFY17 2QFY17 3QFY17 4QFY17 1QFY18 2QFY18 3QFY18 4QFY18 4QFY16 1QFY17 2QFY17 3QFY17 4QFY17 1QFY18 2QFY18 3QFY18 4QFY18 Source: Company, HDFC sec Inst Research Source: Company, HDFC sec Inst Research International generics performance was boosted by strong traction in the US and one off income. International Biz: Pick-Up Driven By Market Share Gains And One Off Income EBITDA Margin: Affected By Higher R&D International Generics (Rs mn) YoY growth (%) EBITDA (Rs mn) 21.6 20.4 EBITDA margin (%) 22.7 22.7 22.3 80.0 20.3 1.7 18.9 18.2 15.8 41.2 33.9 44.9) 22.3 EBITDA margin declined sequentially due to lower gross margin and higher R&D cost 3.1 10.8 ( ) 26.4 ( ) ( 1.5 1.4 1.6 1.8 1.3 1.8 1.0 1.8 3.0 2.8 2.6 2.7 2.5 2.9 3.4 39.4) 2QFY17 3.4 1.9 3QFY18 ( 4QFY16 1QFY17 2QFY17 3QFY17 4QFY17 1QFY18 2QFY18 4QFY18 4QFY16 1QFY17 3QFY17 4QFY17 1QFY18 2QFY18 3QFY18 4QFY18 Source: Company, HDFC sec Inst Research Source: Company, HDFC sec Inst Research Page | 3
ALEMBIC PHARMA:RESULTS REVIEW 4QFY18 Segmental Quarterly Performance (Rsmn) Domestic Formulations International Business API and others Source: HDFC sec Inst Research 4QFY18 3,040 3,520 1,980 8,540 4QFY17 2,860 2,730 1,810 7,400 YoY (%) 3QFY18 3,490 3,110 1,800 8,400 QoQ (%) (12.9) 13.2 10.0 Like-to-like growth in the domestic business would be 8%YoY 6.3 28.9 9.4 15.4 Total 1.7 Despite weak growth in this quarter, the mgt has maintained that they aim to grow the domestic business above the market rate Assumptions FY16 FY17 FY18 FY19E FY20E Domestic formulations Growth (%) 11,873 7.6 12,550 5.7 12,740 1.5 14,367 12.8 16,206 12.8 International Business Growth (%) 14,647 151.7 12,360 (15.6) 12,060 (2.4) 13,978 15.9 16,197 15.9 API Business Growth (%) 5,283 53.8 6,400 (1.5) 6,510 7,158 13.4 7,876 13.5 - Total Source: HDFC sec Inst Research 31,803 53.8 31,310 (1.5) 31,310 35,503 13.4 40,279 13.5 Growth (%) - Page | 4
ALEMBIC PHARMA:RESULTS REVIEW 4QFY18 Peer Valuations Adj EPS (Rs/sh) P/E (x) RoE (%) Mcap (Rsbn) CMP (Rs/sh) Reco TP FY17 FY18E FY19E FY20E FY17 FY18E FY19E FY20E FY17 FY18E FY19E FY20E Sun Pharma Cipla Cadila Healthcare AurobindoPharma Lupin Dr Reddy's Labs Divi's Labs Alkem Laboratories Torrent Pharma Glenmark Jubilant Life Sciences Alembic Pharma DishmanCarbogenAmcis Strides Shasun Granules India Neuland Labs Source: HDFC sec Inst Research 1,135 450 394 352 345 339 309 241 230 146 127 90 57 45 25 6 472 560 384 602 767 1,994 1,165 2,015 1,357 518 816 479 352 499 97 711 NEU NEU BUY BUY BUY NEU NEU BUY BUY BUY BUY NEU BUY BUY BUY BUY 544 631 523 835 1,219 2,320 1,100 2,124 1,748 781 1,060 535 480 980 177 1,065 26.0 12.5 14.5 39.3 33.4 72.7 39.9 74.6 51.2 29.6 37.0 21.4 9.0 34.0 7.5 42.6 14.0 18.4 11.3 35.2 38.0 64.7 33.4 62.6 38.9 18.5 46.6 23.3 9.9 27.7 6.0 11.0 20.1 25.7 16.4 46.0 39.6 116.0 161.0 44.9 85.0 106.2 62.0 30.0 65.5 25.3 15.2 39.0 8.5 28.9 27.2 33.2 22.7 52.2 59.7 18.2 44.8 26.4 15.3 23.0 27.4 29.2 27.0 26.5 17.5 22.1 22.4 39.0 14.7 12.9 16.7 33.8 30.4 33.9 17.1 20.2 30.8 34.9 32.2 34.9 28.0 17.5 20.6 35.6 18.0 16.2 64.8 23.4 21.8 23.4 13.1 19.4 17.2 26.0 23.7 21.9 17.3 12.5 19.0 23.1 12.8 11.4 24.6 17.3 16.9 16.9 11.5 12.8 12.4 22.5 19.0 17.1 11.8 10.1 15.1 15.7 8.4 8.2 11.4 17.9 8.4 23.5 27.6 12.2 9.5 22.0 21.9 22.1 18.1 18.0 23.0 3.0 13.1 21.0 12.8 9.1 11.2 15.4 20.0 12.7 8.4 15.7 15.8 14.9 9.8 19.3 21.2 3.3 4.6 13.7 2.2 12.3 14.0 19.0 21.4 12.5 13.9 18.8 18.8 21.5 14.0 22.4 19.7 4.9 12.9 15.3 5.5 14.8 15.8 22.3 20.0 16.8 17.0 19.0 20.2 23.2 17.5 22.5 21.0 6.8 17.1 18.9 11.1 51.7 79.5 43.8 80.4 31.8 22.4 59.4 11.8 62.3 We have cut our estimates to factor in incremental impact of higher opex, depreciation cost and interest payments in FY19/FY20 Change In Estimates (Consolidated) Previous FY19E New FY19E % Chg FY19E (0.2) (6.3) (12.6) Rsmn FY18E FY20E FY18E FY20E FY18E 1.7 (1.4) (5.3) FY20E Net Sales EBITDA APAT Source: HDFC sec Inst Research 30,780 6,525 4,357 35,168 7,491 4,759 40,178 9,281 6,019 31,308 6,431 4,126 35,100 7,020 4,162 39,822 9,000 5,605 (0.9) (3.0) (6.9) Page | 5
ALEMBIC PHARMA:RESULTS REVIEW 4QFY18 Income Statement (Consolidated) Balance Sheet (Consolidated) FY20E 39,822 13.5 10,354 7,447 8,243 4,779 9,000 22.6 28.2 1,550 7,450 Year ending March (Rsmn) Net Revenues Growth (%) Material Expenses Employee Expenses SG&A Expenses R&D Expenses EBITDA EBITDA Margin (%) EBITDA Growth (%) Depreciation EBIT Other Income (Including EO Items) Interest PBT Tax (Incl Deferred) Minority Interest RPAT EO (Loss) / Profit (Net Of Tax) APAT APAT Growth (%) Adjusted EPS (Rs) Source: Company, HDFC sec Inst Research FY16 31,232 52.2 7,811 4,729 5,554 3,071 10,067 32.2 150.0 722 9,345 FY17 31,052 (0.6) 8,581 5,588 6,465 4,270 6,147 19.8 (38.9) 830 5,318 FY18E 31,308 FY19E 35,100 12.1 9,302 6,950 7,371 4,458 7,020 20.0 As at March (Rsmn) SOURCES OF FUNDS Share Capital - Equity Reserves Total Shareholders Funds Minority Interest Long Term Debt Short Term Debt Total Debt Net Deferred Taxes Other Non- FY16 FY17 FY18E FY19E FY20E 0.8 377 377 377 377 377 8,856 6,228 5,683 4,110 6,431 20.5 4.6 1,055 5,376 15,597 15,974 18,634 19,011 21,824 22,201 24,884 25,261 29,386 29,763 - - 1 - 3 1 1 5,000 2,078 7,078 354 603 5,000 1,500 6,500 369 1,011 3,000 1,000 4,000 369 1,206 1,137 1,137 427 413 802 802 369 698 9.2 1,350 5,670 currentLiabilities&Provns TOTAL SOURCES OF FUNDS APPLICATION OF FUNDS Net Block CWIP Investments Other Non-current Assets Total Non-current Assets Cash & Equivalents Inventories Debtors Other Current Assets Total Current Assets Creditors Other Current Liabilities &Provns Total Current Liabilities Net Current Assets TOTAL APPLICATION OF FUNDS 17,951 20,882 30,240 33,142 35,339 73 25 70 80 100 300 7,250 1,595 (50) 5,605 54 51 34 350 5,400 1,188 (50) 4,162 7,081 1,225 534 333 9,173 4,508 5,698 3,505 1,402 10,604 5,657 678 6,335 4,270 17,951 7,994 4,660 502 501 13,656 1,596 6,328 3,375 1,912 11,615 5,232 753 5,985 5,629 20,882 10,928 9,108 416 711 21,163 899 7,339 5,263 4,746 17,348 7,593 1,577 9,170 8,178 30,240 15,578 9,000 497 711 25,786 282 6,371 4,808 5,320 16,499 7,645 1,780 9,425 7,074 33,142 18,528 6,500 497 711 26,236 1,345 6,241 5,455 6,036 17,732 7,943 2,031 9,973 7,758 35,339 9,363 2,161 (2) 7,201 4,059 3,142 11.0 16.7 5,291 1,222 (37) 4,032 5,413 1,204 (83) 4,126 - - - - 5,605 34.7 29.7 4,032 28.3 21.4 4,126 2.3 21.9 4,162 0.9 22.1 Source: Company, HDFC sec Inst Research Page | 6
ALEMBIC PHARMA:RESULTS REVIEW 4QFY18 Cash Flow Year ending March (Rsmn) Reported PBT Non-operating & EO items Interest expenses Depreciation Working Capital Change Tax Paid OPERATING CASH FLOW ( a ) Capex Free cash flow (FCF) Non-operating Income INVESTING CASH FLOW ( b ) Debt Issuance/(Repaid) Interest Expenses FCFE Share Capital Issuance Dividend Others FINANCING CASH FLOW ( c ) NET CASH FLOW (a+b+c) EO Items, Others Closing Cash & Equivalents Key Ratios FY20E 7,250 FY16 9,363 FY17 5,291 FY18E 5,413 FY19E 5,400 FY16 FY17 FY18E FY19E FY20E PROFITABILITY (%) GPM EBITDA Margin APAT Margin RoE RoIC (or Core RoCE) RoCE EFFICIENCY Tax Rate (%) Fixed Asset Turnover (x) Inventory (days) Debtors (days) Other Current Assets (days) Payables (days) Other Current Liab&Provns (days) Cash Conversion Cycle (days) Debt/EBITDA (x) Net D/E (x) Interest Coverage (x) PER SHARE DATA (Rs) EPS - - - - - 75.0 32.2 10.1 24.5 60.9 21.0 72.4 19.8 13.0 23.0 26.5 21.0 71.7 20.5 13.2 20.0 18.0 16.2 73.5 20.0 11.9 17.5 14.8 14.0 74.0 22.6 14.1 20.4 18.0 17.1 200 1,550 (489) (1,595) 6,916 (2,000) 4,916 100 (1,900) (2,500) (300) 2,216 (18) 722 1,219 (1,974) 9,311 (3,086) 6,225 27 830 (36) 1,055 (2,854) (1,218) 2,359 (8,436) (6,077) 270 1,350 1,511 (1,173) 7,358 (5,893) 1,465 (1,242) (1,280) 3,625 (5,047) (1,422) 23.1 2.9 66.6 41.0 16.4 66.1 7.9 49.9 0.1 (0.2) 172.1 23.1 2.5 74.4 39.7 22.5 61.5 8.9 66.2 0.1 (0.0) 103.9 22.2 1.9 85.6 61.4 55.3 88.5 18.4 95.3 1.1 0.3 158.1 22.0 1.6 66.3 50.0 55.3 79.5 18.5 73.6 0.9 0.2 16.2 22.0 1.5 57.2 50.0 55.3 72.8 18.6 71.1 0.4 0.1 24.8 73 25 70 80 (3,010) (1,121) (54) 5,127 (4,990) (335) (51) (1,751) (8,280) 6,275 (34) 320 (5,893) (578) (350) 537 - - - - - (1,103) (882) (2) (2,055) 4,246 (882) 279 (1,547) (2,912) (992) 40 5,209 (713) (1,103) 50 52 (3,953) 1,063 (2,083) (618) - - - - - 1,345 4,508 1,596 883 282 16.7 21.4 21.9 22.1 29.7 Book Value VALUATION P/E (x) P/BV (x) EV/EBITDA (x) EV/Revenues (x) OCF/EV (%) FCF/EV (%) FCFE/Mkt Cap (%) Dividend Yield (%) Source: Company, HDFC sec Inst Research Page | 7
ALEMBIC PHARMA:RESULTS REVIEW 4QFY18 RECOMMENDATION HISTORY Date 3-May-17 20-Jul-17 10-Oct-17 8-Nov-17 11-Jan-18 31-Jan-18 13-Apr-18 17-May-18 CMP 605 552 503 515 563 567 500 480 Reco BUY BUY BUY NEU NEU NEU NEU NEU Target 675 635 650 555 590 605 575 535 Alembic Pharma TP 800 750 700 650 600 550 500 450 400 Rating Definitions BUY NEUTRAL : Where the stock is expected to deliver (-)10% to 10% returns over the next 12 month period SELL : Where the stock is expected to deliver less than (-)10% returns over the next 12 month period May-18 Feb-18 May-17 Nov-17 Jan-18 Mar-18 Aug-17 Oct-17 Jun-17 Jul-17 Dec-17 Apr-18 Sep-17 : Where the stock is expected to deliver more than 10% returns over the next 12 month period Page | 8
ALEMBIC PHARMA:RESULTS REVIEW 4QFY18 Disclosure: I, AmeyChalke, MBA, author and the name subscribed to this report, hereby certify that all of the views expressed in this research report accurately reflect our views about the subject issuer(s) or securities. HSL has no material adverse disciplinary history as on the date of publication of this report. We also certify that no part of our compensation was, is, or will be directly or indirectly related to the specific recommendation(s) or view(s) in this report. Research Analyst or his/her relative or HDFC Securities Ltd. does not have any financial interest in the subject company. Also Research Analyst or his relative or HDFC Securities Ltd. or its Associate may have beneficial ownership of 1% or more in the subject company at the end of the month immediately preceding the date of publication of the Research Report. Further Research Analyst or his relative or HDFC Securities Ltd. or its associate does not have any material conflict of interest. Any holding in stock –No HDFC Securities Limited (HSL) is a SEBI Registered Research Analyst having registration no. INH000002475. Disclaimer: This report has been prepared by HDFC Securities Ltd and is meant for sole use by the recipient and not for circulation. The information and opinions contained herein have been compiled or arrived at, based upon information obtained in good faith from sources believed to be reliable. Such information has not been independently verified and no guaranty, representation of warranty, express or implied, is made as to its accuracy, completeness or correctness. All such information and opinions are subject to change without notice. This document is for information purposes only. Descriptions of any company or companies or their securities mentioned herein are not intended to be complete and this document is not, and should not be construed as an offer or solicitation of an offer, to buy or sell any securities or other financial instruments. This report is not directed to, or intended for display, downloading, printing, reproducing or for distribution to or use by, any person or entity who is a citizen or resident or located in any locality, state, country or other jurisdiction where such distribution, publication, reproduction, availability or use would be contrary to law or regulation or what would subject HSL or its affiliates to any registration or licensing requirement within such jurisdiction. If this report is inadvertently send or has reached any individual in such country, especially, USA, the same may be ignored and brought to the attention of the sender. This document may not be reproduced, distributed or published for any purposes without prior written approval of HSL. Foreign currencies denominated securities, wherever mentioned, are subject to exchange rate fluctuations, which could have an adverse effect on their value or price, or the income derived from them. In addition, investors in securities such as ADRs, the values of which are influenced by foreign currencies effectively assume currency risk. It should not be considered to be taken as an offer to sell or a solicitation to buy any security. HSL may from time to time solicit from, or perform broking, or other services for, any company mentioned in this mail and/or its attachments. HSL and its affiliated company(ies), their directors and employees may; (a) from time to time, have a long or short position in, and buy or sell the securities of the company(ies) mentioned herein or (b) be engaged in any other transaction involving such securities and earn brokerage or other compensation or act as a market maker in the financial instruments of the company(ies) discussed herein or act as an advisor or lender/borrower to such company(ies) or may have any other potential conflict of interests with respect to any recommendation and other related information and opinions. HSL, its directors, analysts or employees do not take any responsibility, financial or otherwise, of the losses or the damages sustained due to the investments made or any action taken on basis of this report, including but not restricted to, fluctuation in the prices of shares and bonds, changes in the currency rates, diminution in the NAVs, reduction in the dividend or income, etc. HSL and other group companies, its directors, associates, employees may have various positions in any of the stocks, securities and financial instruments dealt in the report, or may make sell or purchase or other deals in these securities from time to time or may deal in other securities of the companies / organizations described in this report. HSL or its associates might have managed or co-managed public offering of securities for the subject company or might have been mandated by the subject company for any other assignment in the past twelve months. HSL or its associates might have received any compensation from the companies mentioned in the report during the period preceding twelve months from t date of this report for services in respect of managing or co-managing public offerings, corporate finance, investment banking or merchant banking, brokerage services or other advisory service in a merger or specific transaction in the normal course of business. HSL or its analysts did not receive any compensation or other benefits from the companies mentioned in the report or third party in connection with preparation of the research report. Accordingly, neither HSL nor Research Analysts have any material conflict of interest at the time of publication of this report. Compensation of our Research Analysts is not based on any specific merchant banking, investment banking or brokerage service transactions. HSL may have issued other reports that are inconsistent with and reach different conclusion from the information presented in this report. Research entity has not been engaged in market making activity for the subject company. Research analyst has not served as an officer, director or employee of the subject company. We have not received any compensation/benefits from the subject company or third party in connection with the Research Report. HDFC securities Limited, I Think Techno Campus, Building - B, "Alpha", Office Floor 8, Near Kanjurmarg Station, Opp. Crompton Greaves, Kanjurmarg (East), Mumbai 400 042 Phone: (022) 3075 3400 Fax: (022) 2496 5066 Compliance Officer: Binkle R. Oza Email: complianceofficer@hdfcsec.com Phone: (022) 3045 3600 HDFC Securities Limited, SEBI Reg. No.: NSE-INB/F/E 231109431, BSE-INB/F 011109437, AMFI Reg. No. ARN: 13549, PFRDA Reg. No. POP: 04102015, IRDA Corporate Agent License No.: HDF 2806925/HDF C000222657, SEBI Research Analyst Reg. No.: INH000002475, CIN - U67120MH2000PLC152193 Mutual Funds Investments are subject to market risk. Please read the offer and scheme related documents carefully before investing. Page | 9
ALEMBIC PHARMA:RESULTS REVIEW 4QFY18 HDFC securities Institutional Equities Unit No. 1602, 16th Floor, Tower A, Peninsula Business Park, SenapatiBapatMarg, Lower Parel,Mumbai - 400 013 Board : +91-22-6171-7330www.hdfcsec.com Page | 10