Download
1 / 21
210 likes | 333 Vues
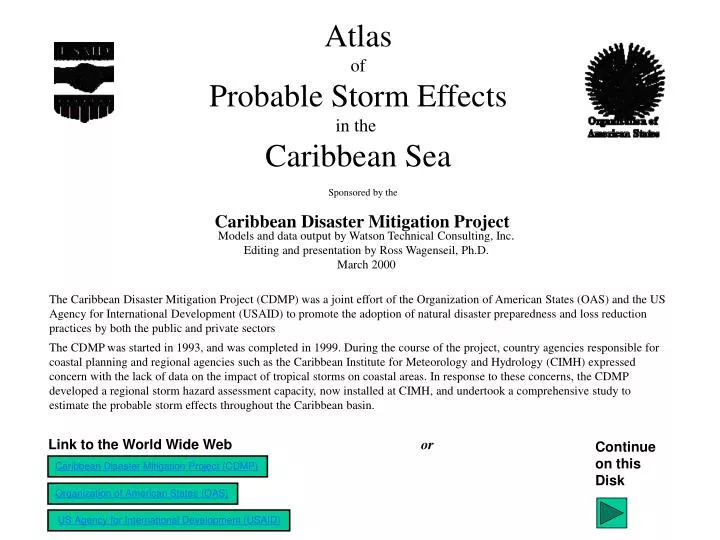
Atlas of Probable Storm Effects in the Caribbean Sea. Sponsored by the. Caribbean Disaster Mitigation Project. Models and data output by Watson Technical Consulting, Inc . Editing and presentation by Ross Wagenseil, Ph.D. March 2000.

E N D
Atlas of Probable Storm Effects in the Caribbean Sea Sponsored by the Caribbean Disaster Mitigation Project Models and data output by Watson Technical Consulting, Inc. Editing and presentation by Ross Wagenseil, Ph.D. March 2000 The Caribbean Disaster Mitigation Project (CDMP) was a joint effort of the Organization of American States (OAS) and the US Agency for International Development (USAID) to promote the adoption of natural disaster preparedness and loss reduction practices by both the public and private sectors The CDMP was started in 1993, and was completed in 1999. During the course of the project, country agencies responsible for coastal planning and regional agencies such as the Caribbean Institute for Meteorology and Hydrology (CIMH) expressed concern with the lack of data on the impact of tropical storms on coastal areas. In response to these concerns, the CDMP developed a regional storm hazard assessment capacity, now installed at CIMH, and undertook a comprehensive study to estimate the probable storm effects throughout the Caribbean basin. Link to the World Wide Web or Continue on this Disk Caribbean Disaster Mitigation Project (CDMP) Organization of American States (OAS) US Agency for International Development (USAID)
10yr 25yr 50yr 100yr SELECT Wind Wave Surge To Navigate Through this Atlas, there are hyperlinks on each page. On most pages you will see a button labeled “Return to Directory” to take you directly to the Directory and Table of Contents. That is a page that links to all sections. You may also see green buttons which allow you to go back or forward in the slide sequence or to back-track to the last slide viewed. These buttons are restricted to a particular section. You may click to the next slide right now to see the Directory (with links to support materials), or you may click on a key map, below, to pick a region. Return to Directory Previous slide Back-track to last slide viewed (within the region) Next slide To explore the maps, you must pick a region by clicking on a key map. There will be two key maps. The first key map allows you to select the Caribbean Sea as a whole, or one of its three main basins. Caribbean West Basin Mid- Basin East Basin or The second key map can take you to one of eight smaller regions, centered on inhabited land. Once you have jumped to a specific region, the corresponding frame on the key map is colored orange. NOTE: Most computers are configured to keep recent pages in RAM. If you browse through many maps, your RAM may fill up and your system may start to get the hyperlinks confused. Simply close the files (using the ESCape key) and reopen for a fresh start. When you jump to a new region, you will see an orientation map with a few place names. You will also see a key pad like the one at left. Use the key pad to jump to another map for your current region. You can select by the probable return time and by the phenomenon. For instance, if you want to view the maps of wave heights with probable return times of 10, 25, 50, and 100 years, just click along the second row, from left to right. Once you have a map displayed, the corresponding button on the keypad is orange. (The keypad at left is not connected; you will have to pick a region first.) To leave the Atlas, press the ESC key on your computer. You may have to press it several times to close all the sections. Esc
Supporting Materials in this Atlas Directory and Table of Contents Includes a short note on the sponsoring project, CDMP. Title Page Hyperlinks and graphical keys. To Navigate Through This Atlas Brief, for the generalist. Introduction For technical background. Methodology of the Statistics Examples of statistical and field validation. Validation of the Model Weaknesses in the input data show in several specific ways. Known Issues in the Input Data The interaction of wind, waves, and surges. A Short Review of Storm Effects There are cartographic distortions in the maps, but not the model. Distortions of the Projection “Wind,” “wave,” and “surge” have specific meanings in this Atlas. Definitions Discussion of alternative wind durations and altitudes. Measures of Wind Speed Supporting Materials on the World Wide Web Links to the Maps Caribbean Disaster Mitigation Project (CDMP) Organization of American States (OAS) Caribbean West Basin TAOS Storm Hazard Modeling Watson Technical Consulting, Inc. Mid- Basin East Basin TAOS Data Sources Caribbean Institute of Meteorology and Hydrology (CIMH) US Agency for International Development (USAID) US National Hurricane Center
Introduction page 1/3 20.25 N 59 W 72 W Ross Wagenseil for CDMP January 2000 10.25 N CDMP This Atlas presents the Caribbean as it has never been seen before. The maps in this Atlas show potential storm phenomena which are most likely to occur (Maximum Likelihood Estimates, or MLEs) during specific durations of time. There are three phenomena: maximum winds, maximum wave heights, and maximum storm surges. Each of the three phenomena is shown for four return periods: 10, 25, 50 and 100 years. There are twelve regional sections of maps: starting with views of the Caribbean as a whole, windowing-in on three main basins of the sea, and windowing even further onto eight sub-regions with significant land masses. Each of the regions includes a simple orientation map, but the essence of the Atlas is in the twelve maps which follow. This could be a bewildering array of information, so every effort has been made to help the user explore without getting lost. The maps are color-coded, and it takes no more than two hyperlinks to go from one map to any other in the Atlas. The maps do not show what exists, but what might exist. Indeed, the concept is even more restricted than that, since the phenomena shown on a single map could not possibly exist at a single point in time. The figure at right is an example. It shows the magnitude of storm surge most likely to occur once in 50 years, on a long-term average, over the East Basin of the Caribbean. In any one location, there is only a 2% chance of such a large surge occurring in any single year, and there is a 64% chance† that the value could be exceeded in any particular period of 50 years. Most important, it is impossible for all these values to happen at the same time because the sea water must be “borrowed” from one area to surge up in another. Hurricane Historical Records In that sense, the map is not a continuous field but an array of points. Each of these points got its value from mathematical manipulation of the historical record kept by the US National Hurricane Center. The historical record includes 973 tropical cyclones (tropical storms and hurricanes), over the 114 years from 1885 to 1998, inclusive. What makes the maps coherent is that the historical record was processed by an advanced numerical model, TAOS (The Arbiter of Storms), which applied basic equations of physics to a digital, three-dimensional topographic map. For the map above, TAOS calculated the surge that each one of those 973 storms would have caused at each location. This required mapping the storms as they passed, calculating the resultant winds and pressure, and calculating the fluid dynamics of the sea water as it flowed around the coasts and over the depths of a three-dimensional model of the Caribbean until it reached the location in question. †Probability that the 50 year return value will be exceeded at least once in a 50-year period: P= 1-(1-1/T)^N. With T=50 and N=50, P = 0.63583 Return to Directory
Introduction page 2/3 Once all the storms had been modeled for a point, the maximum for each year was selected. That gave 114 maxima, to which a smooth curve was fitted. That curve was taken as the probability density function of surge for the single point. The 2% cumulative probability was taken as the Maximum Likelihood Estimate (MLE) for the surge with a 50-year return time at that location, and the corresponding surge value was mapped for the location. Each point on the map was calculated individually in this way. Marilyn, 1995 And yet the points do fit together. Anyone who has followed storm reports during the hurricane season in the Caribbean has developed an intuition for what is likely to develop. There is a pattern. Recognizing Patterns Hurricane Marilyn and Hurricane Gilbert are examples. Although they were not predictable, they were both, in some way, typical. The maps of this Atlas show that they both moved through areas of high probability: a southern pathway over Jamaica and a pathway curving north of Puerto Rico. The model calculated the pattern by applying the laws of physics to the reefs and islands of the topographic map. Gilbert, 1988 Click for enlargement Both Marilyn and Gilbert started in the Western Atlantic and passed just north of Barbados. This pathway is sometimes referred to as “hurricane alley.” The hurricane alley is far enough south for the sea water to have warmed to 27C, a critical temperature that sustains convective clouds which move along with the trade winds. The alley is also far enough north for a strong Coriolis effect, and it is far enough west for the Coriolis effect to have had time enough to twist convective clouds, moving with the trade winds, into circular storm systems. These storm systems are tropical cyclones, and the strongest of them, in the Caribbean, are the hurricanes. This part of the pattern is already well-known. The Atlas shows other parts of the pattern, some of which are less-known or only guessed at up until now. For instance, there is a distinct “shadow” to the west and north of the Greater Antilles. This is not a result of decreased activity or changes to the steering patterns directing the tropical cyclones. A review of the track maps indicates that there are as many tropical cyclones moving over the Greater Antilles as there are to the immediate north and south. What decreases is not the frequency of the storms but their intensity. This is due to several related factors: 1. Air circulation at the low and middle levels is disrupted by the extensive mountains of Hispaniola and Cuba. 2. Surface humidities decrease slightly under the larger air mass. 3. Direct evaporation from the sea is cut off while the convective core of the storm is over land. Return to Directory
Introduction page 3/3 Most of the islands do not disrupt storms very much, because the islands are smaller than the core circulation of a tropical cyclone. Jamaica and Puerto Rico are almost big enough to disrupt a storm. In fact, Jamaica does affect storms moving from south to north, but such storms are much rarer than storms arriving from the east and this barely shows on the probability maps. As storms move over Hispañola, however, they begin to break up and they cannot recover until they pass Cuba. By far the prevailing direction of motion of storms in the Caribbean is from east-southeast to west-northwest, but some storms such as Marilyn move on a track closer to southeast-northwest, depending on upper-level winds and frontal systems in the Temperate Zone. Thus, the shadow of the Greater Antilles is a complex interaction of the increase in intensity from south to north, the disruptive effect of the largest islands, and the interaction of tropical cyclones with the Easterlies above 20 degrees north latitude. The effect is subtle and complex, but it is real. The Atlas shows the probable results of all these factors together. Interpretation of Maps These maps are not designed to be queried out of context, on a cell-by-cell basis. Doing so would create a false impression of accuracy which cannot be delivered from the input data available at this time. The input topographic data has a nominal resolution of 30 arc-seconds (slightly less that 1 kilometer), but in some areas the data are from coarser datasets. Site-specific accuracy can only be obtained from an analysis at a much higher resolution (in the range of 3 arc-seconds), which requires a significant investment in high-resolution bathymetry and elevation data. CDMP has done several high-resolution studies with good success. Evaluation of these studies shows that the results are consistent with the results obtained in this Atlas. On the other hand, some of the patterns in the Atlas are poorly understood, and site-specific studies may help to investigate these effects. Hurricane Marilyn and Hurricane Gilbert caused substantial damage and they are fresh in memory, but it has been difficult to know how soon such storms would come again. It has been difficult to gauge the risk, to plan for the next emergency. The information contained in this Atlas enables emergency managers and physical planners to better understand the probability of occurrence of winds, waves, and surges associated with tropical cyclones. Areas of higher risk from one or more of these hazards may require specific development policies or building standards. Emergency management plans will need to pay special attention to settled areas or critical infrastructure located in areas of high risk. The definition of MLE used in this study is consistent with the definition commonly used in building codes such as the ASCE-7†. MLE values can thus be used in the formulas suggested in the codes. Since the MLE values corresponding to a given return period can easily be exceeded during that period (the 50-year return wind speed has a 64% probability of being exceeded), higher estimates, corresponding to more stringent prediction limits (75%, 90% or 95%), may be called for when planning or designing facilities that need to withstand even the most unlikely events. These estimates can be produced for given locations by the CIMH. Return to Directory †Wind Loading Standards produced by the American Society of Civil Engineers
Statistical Methodology Page 1/3 Slight variations in storm track can make large differences in the effects a storm has on one area. For any given location, a hurricane passing fifty miles away may cause the same winds as a moderate tropical storm passing right overhead. For each grid cell in the study area, the TAOS model was used to calculate wind effects for each storm in the tropical cyclone database (973 events in the Atlantic as of December 1998) on that location. We then used the output to perform a maximum-likelihood-analysis to generate the optimal estimates of parameters for a two-parameter Weibull model. The two-parameter Weibull distribution has the cumulative distribution function (cdf) And the probability density function (pdf) • where • x>0 is the magnitude of the event, • is the shape parameter, • is the scale parameter. Return to Directory This distribution is positive, right skewed, unimodal and flexible enough to accommodate distribution shapes encountered in this project. If the shape parameter is unity (1), then the curve is a simple exponential, with the highest probability density at zero. That would imply that most years have no wind or storm surge at all. If is higher than one, then there is a mode at some value above zero. Either way, there are more low values than high ones, but high values are possible. The shape parameter and the scale parameter can both be estimated from data using the method of maximum likelihood. The maximum likelihood estimators of the two parameters are approximately bivariate normally distributed with mean vector (, ) and covariance provided by the observed Fisher information matrix. Caribbean West Basin Mid- Basin East Basin
Statistical Methodology Page 2/3 The maximum likelihood estimator of the return period wind is obtained by inverting the distribution function at the appropriate percentile: • Where • 90th percentile implies 10 year return period wind speed, • 96th percentile implies 25 year return period wind speed, • 98th percentile implies 50 year return period wind speed, • 99th percentile implies 100 year return period wind speed. To obtain simulated confidence limits, we generate realizations of (, ) according to its asymptotic distribution, compute the corresponding return period wind speed, and then sort the values to extract suitable limits reflecting the uncertainty in estimation. General principles of maximum likelihood estimation can be found in standard graduate mathematical statistics books. The simulation process is straightforward (Johnson, Multivariate Statistical Simulation, Wiley, 1987). In brief: 1. The annual maxima are treated in the fitting process as independent and identically distributed variates. Extensive consideration of lag correlations reveals little regularity in cycles relative to noise. 2. The two-parameter Weibull distribution is used for annual maxima. Consideration of potential competing lognormal and inverse Gaussian distributions revealed the relative superiority of the Weibull distribution. Goodness-of-fit tests applied throughout the Atlantic Basin (over 600,000 locations) demonstrated the adequacy of the Weibull distribution. 3. In terms of data “quality,” many sensitivity analyses have been conducted to support the use of the full 1886-present data set. Supposed difficulties with the “older” events are not reflected in analyses with various subsets of the data. Hence, there appears to be no gain for dropping pre-1950 data. 4. Our analyses are not dominated by the single most extreme event at a particular site. This is quite comforting in that we wish to smooth the storm history to regions that have not experienced many extreme events. The Weibull fitting methodology provides an indirect smoothing that appears reasonable and is consistent with the historical record. Return to Directory Caribbean West Basin Mid- Basin East Basin
0.5 0.4 0.3 Fraction of All Occurrences 0.2 0.1 0.0 Peak Wind Speed for the Year: Knots 50 60 70 30 0 20 40 80 120 160 90 110 100 140 10 130 150 Statistical Methodology Page 3/3 Below is an example of the Weibull curve fitted to the HURDAT historic record for a project completed in 1998. For each storm, the model TAOS calculated the winds produced over downtown Kingston, Jamaica. The winds were grouped by years, and the peak wind for each year of the 112 years in the database selected. Then the 112 peak yearly winds were grouped for this histogram. Kingston, Jamaica Histogram of Historic Occurrences and Two-Parameter Weibull fit = 1.194302 = 28.483850 2 = 20.568573 K-S = 0.098214 K-S prob. = 0.630202 Return to Directory Caribbean West Basin Mid- Basin East Basin
The TAOS Model and Model Validation Page 1/2 The Arbiter of Storms (TAOS) is a computer-based numerical model that produces estimates of maximum sustained wind vectors at the surface and still water surge height and wave height at the coastline for any coastal area in the Caribbean basin. Model runs can be made for any historical storm, for probable maximum events, or using real-time tropical storm forecasts from the US National Hurricane Center (NHC). TAOS is integrated into a geographic information system (GIS), which eases entry of model data, enables the presentation of model results in a format familiar to meteorological officials in the Caribbean region and allows the results to be combined with locally available GIS and map information. , meters Return to Directory Caribbean West Basin The TAOS model has been tested extensively against hurricanes and typhoons around the world. There are 460 observations on the US Gulf and Atlantic coasts, 36 observations in Hawaii, 42 observations in the Caribbean, and 28 observations in the remainder of the world (such as Japan, Taiwan, India and Bangladesh), for a total of 566 peak surge observations from 27 storms worldwide. Including comparisons with hourly tide-gauge readings, there are over 1200 observations in the TAOS verification database. From this, TAOS/C appears to generate results within 0.3 meters (less than 1 foot) 80% of the time, and less than 0.6 meters (about 2 feet) 90% of the time. The scatter plot above shows the results of US mainland storm surge comparisons. Mid- Basin East Basin
The TAOS Model and Model Validation Page 2/2 Because the TAOS model uses basic physical relationships, it works across a wide range of scales. For instance, a study was done of the west coast of Dominica, using a resolution of 30 meters. In 1995, as the study was finishing, Hurricane Marilyn visited the island. A field visit several weeks later found that the model had accurately predicted damage areas as small as two to three cells wide. CDMP Storm Hazard Modeling Page Return to Directory Caribbean West Basin Mid- Basin East Basin
1. Bathymetry in most areas only has a resolution of 5 arc-minutes. This creates a “blocky” sea floor which shows on some of the wave maps. Example: Belize, 100-year Waves 2. The lack of input detail in the open sea also caused the model to produce horizontal “banding” 5 arc-minutes wide on some maps of winds and waves. Example: Jamaica 100-year Waves 3. Where the bathymetry was updated with marine track line data from another source, the depths appear inconsistent, and “speckles” appear in a few areas on the model results. Example: West Basin 100-year Waves 4. Some of the track lines are out of place. This had little effect on the overall results, but there are a few stray cells of erroneous data on shore. Example: Windward Islands, North, 100-year Surges Known Issues in the Input Data The input data used to develop this atlas is based on USGS digital data for deep ocean bathymetry, Digital Chart of the World data for land boundaries and rough topography, satellite imagery for foreshore bathymetry and land cover. This base information was then updated with point sounding and trackline information. The input data has a nominal resolution of 30 arc-seconds (926 meters or less, depending on latitude and orientation), but it is not reliable in such detail. Storm track information used for modeling was derived from a database developed by the U.S. National Hurricane Center. See the web link in the directory for more information on data sources. The database is not designed to be queried out of context, on a cell-by-call basis. Doing so would create a false impression of accuracy which can not be delivered from the input data available at this time. It is a measure of the power of the model that it reveals weaknesses in the input data at the geographic locations where they occur, without spreading inconsistencies across wide areas. Data issues show up in several specific ways: Return to Directory Caribbean West Basin Mid- Basin East Basin
A Short Review of Storm Effects Page 1/5 Rain and wind In an ordinary thunderstorm, the rain falls out of the cloud leaving the air warmer and drier. The warm air rises, drawing winds from outside the cloud to fill the space. In a hurricane, the thunderstorm is so large that it is twisted by the spin of the Earth and the winds form a spiral, directed inwards from all points of the compass. Return to Directory Photo by permission of Michael Bath. http://australiansevereweather.simplenet.com/photography/cbincu11.htm
A Short Review of Storm Effects Page 2/5 Cyclonic structure Return to Directory All of the Caribbean is north of the Equator, so hurricanes in the Caribbean spin counter-clockwise. Photo by permission of Scott Dommin. http://members.aol.com/hotelq/index.html
A Short Review of Storm Effects Page 3/5 Topographic effects Acceleration Turbulence Back Pressure LAND OPEN SEA Definitions When winds reach an obstacle, they may accelerate in order to squeeze past or they may be slowed by back pressure. In the lee of an obstacle, the winds are confused and turbulent. Return to Directory
A Short Review of Storm Effects Page 4/5 Wind Stress Counter-current Wind over water As storm winds blow over the sea, they drag on the water, forming waves and storm currents In this Atlas, wind speeds represent sustained 1-minute winds at 10 meters above the surface. Wave build-up Wind-induced Current Deep counter-currents and upwelling develop in order to compensate for the drift near the surface. These effects may penetrate down to 200 meters depth. Definitions Return to Directory
A Short Review of Storm Effects Page 5/5 In this Atlas, 1. Wave heights are the heights of wave crests above the storm surge. 2. Storm surges include astronomical tide and setups from pressure, wind and wave, but not wave runup. Definitions Return to Directory
Hurricane Marilyn passed just north of Puerto Rico and then turned northeast as it caught the effect of weather systems in the north temperate region. Marilyn, 1995 Hurricane Gilbert passed directly over Jamaica without being disrupted. If it had passed over the Dominican Republic, Haiti, or Cuba, the large land masses would have changed and weakened it. Storms originating east of Barbados may head directly west-northwest or veer to the north. Gilbert, 1988 Return to Directory Caribbean West Basin Mid- Basin East Basin
b a x y a Distortions of the Projection The WGS84 datum models the Earth as an ellipsoid. Calculations of distortions of units of Longitude for using a square grid representation of Latitudes & longitudes on a WGS84 datum Major semiaxis = 6378137.00000 meters Minor semiaxis = 6356752.31400 Latitude tangent(lat) ratio stretching comments 0 0 1.00000 1 equator 8 0.140540835 0.99020 1.009893 Full frame, S 9 0.15838444 0.98761 1.012549 Carib Frame, S 10.25 0.180829457 0.98394 1.016327 East Basin, S 10.75 0.189855932 0.98234 1.017982 Mid Basin, S 11.5 0.203452299 0.97979 1.020623 Windwards, South, S 14 0.249328003 0.97010 1.030817 West Basin, S 14.25 0.253967646 0.96903 1.031957 Windwards North, S 14.25 0.253967646 0.96903 1.031957 Windards, South, N 15.8 0.282971477 0.96198 1.039525 Belize, S 16.5 0.296213495 0.95856 1.043232 Leewards, S 16.6667 0.299380981 0.95772 1.044142 Windwards North, N 17 0.305730681 0.95603 1.045993 Jamaica, S 17 0.305730681 0.95603 1.045993 PRVI, S 17.5 0.315298789 0.95343 1.048849 Haiti, S 17.5 0.315298789 0.95343 1.048849 Dom Rep, S 18.6 0.336537181 0.94744 1.055472 Belize N 18.75 0.339454259 0.94660 1.056412 Leewards, N 19 0.344327613 0.94518 1.057998 Jamaica, N 19.5 0.354118573 0.94229 1.061247 PRVI, N 20.166667 0.367267976 0.93832 1.065737 DomRep, N 20.25 0.368919477 0.93781 1.066311 East Basin, N 20.3333 0.370572096 0.93731 1.066888 Haiti, N 20.75 0.378866109 0.93474 1.069816 Mid basin, N 23 0.424474816 0.92003 1.086919 Carib frame, N 35 0.700207538 0.81825 1.222127 North Carolina 45 1 0.70592 1.416594 Maine 75 3.732050808 0.25801 3.875832 Hudson Bay The formula of an ellipse is Where a and b are the major and minor semiaxes. a b = = In re-projecting to the Plate Carrée, north-south distances are undistorted, but east-west distances are distorted in proportion to their latitude. The distortion can be calculated by finding the ratio of the local rotational radius (x) to the length of the major semiaxis (a) Return to Directory Latitude Caribbean West Basin Mid- Basin East Basin
Definitions • WINDS: The winds displayed in this product are compatible with “one-minute sustained” winds, 10 meters above the surface, as reported by the U.S. National Hurricane center (NHC). • For a brief discussion of converting from one standard of wind measurement to • another, click HERE: • SURGES include astronomical tide and setups from pressure, wind and wave, but not wave run-up. Surges over land are shown as elevation above sea level, not water depth. • WAVES are the heights of wave crests above the storm surge level in open water. Shoreline effects do not appear at this resolution. Measures of Wind Speed Return to Directory Caribbean West Basin Mid- Basin East Basin
Measures of Wind Speed The winds displayed in this Atlas are “one-minute sustained winds, 10 meters above the surface,” which are compatible with the wind speed representation used by the U.S. National Hurricane center (NHC) in its forecasts and reports of tropical cyclones. The NHC is designated by the World Meteorological Organization (WMO) as the Regional Specialized Forecast Center for tropical cyclones in the Atlantic Basin. Internally, TAOS computes instantaneous values for mean wind at the top of the boundary layer, which is effectively the same as the 10-minute averaged wind used by the WMO. To conform to the slightly different “one-minute, sustained winds 10 meters above the surface” reported by the NHC, the wind values produced by the TAOS model are then brought down to the surface with boundary-layer calculations and converted to “one-minute sustained averages at an elevation of 10 meters.” Users requiring alternate wind representations may use the following conversion factors to obtain approximate values: Return to Directory For example, to get 10-minute winds, multiply values from this Atlas by 0.8125. Research is continuing into the relationships between these various measures. Turbulent flow over land is particularly complex, and gust factors may need to be site-specific. Further discussion is in Simiu and Scanlan, Wind Effects on Structures, 3rd edition, Wiley, 1996, and in Sparks, P.R., and Huang, Z., "Wind speed characteristics in tropical cyclones", Proceedings of the Tenth International Conference on Wind Engineering, Copenhagen Denmark, 21-24 June 1999. In this Atlas, wind speed over land includes both surface friction (keyed to land cover) and topography along the flow path at a resolution of 30 arc-seconds. If using wind damage models or building codes which internally include surface friction or topographic corrections, the nearest open-water wind speed should be used as input. Caribbean West Basin Mid- Basin East Basin