Understanding the Impact of Wing Length on Airplane Descent Time: A Science Experiment
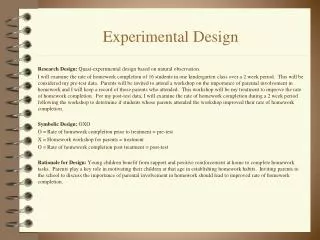
This guide outlines how to design a science experiment, focusing on the relationship between wing length and the time it takes for an airplane to descend. By starting with a clear question and formulating a hypothesis, the experimental process is detailed through defining variables, materials, and procedures. It emphasizes the importance of controlling conditions, conducting repeated trials, and gathering both qualitative and quantitative data. Additionally, it discusses analyzing results, potential experimental errors, and conclusions drawn from the findings, along with suggestions for future research.


Understanding the Impact of Wing Length on Airplane Descent Time: A Science Experiment
E N D
Presentation Transcript
EXPERIMENTAL DESIGN Science answers questions with experiments
Begin by asking a question about your topic DEFINE THE PROBLEM What is a good question for an experiment? One that is testable with the materials at hand
Now we need a hypothesis to guide our investigation. What is a hypothesis? Your best thinking about how the change you make might affect another factor. Tentative or trial solution to the question.An if ………… then ………… statement.
Design an Experiment • Must design an experiment that will test your hypothesis. • This experiment will allow you to change some conditions or variables to test your hypothesis.
Variables Variables are things that change. The independent variable is the variable that is purposely changed. It is the manipulated variable. The dependent variable changes in response to the independent variable. It is the responding variable.
Constants or Controlled Variables in an Experiment What are constants in an experiment? Factors that are kept the same and not allowed to change. It is important to control all but one variable at a time to be able to interpret data
Materials and Procedures • A description of what you will use for your experiment, and how you will do it. • Be sure to include: • Listing of the Variables • Repeated Trials • Drawing of Apparatus
How will you vary the Independent Variable How many different values of the independent variable should we test? 3 ? 5? 10? The more the better?
Repeated Trials What are repeated trials? The number of times that a value of the independent variable is tested. Why are repeated trials necessary? They reduce the possibility of chance errors affecting the results.
Drawing of Experiment Include Labels to clearly identify the important parts of the experimental setup
Qualitative Observations and Results What are qualitative observations? They are what you perceive that occurred during the course of your experiment. They are identification of trends in the data.
Quantitative Observations and Results What are quantitative observations? Numbers in the form of raw data displayed in data tables and graphs
Sample Data Table Title: The Effect of the independent variable on the dependent variable
Graphs Title: The Effect of the independent variable on the dependent variable Independent Variable – include units and an appropriate scale
Analysis and Interpretation of ResultsThis is where you describe in words what is illustrated by your data as shown in your table and graph You also describe the meaning of the results
Possible Experimental Errors What factors in your materials or procedure might have had an impact on your results?
Conclusion Why or why not your results supported or did not support the hypothesis. Hypotheses are never “wrong”. They are either supported or not supported. Include reasons for the hypothesis to be supported or unsupported.
Recommendations for Further Experimentation What are some practical applications of your results? What other questions that could be tested arise from your results?
Sample experiment with data • Students were asked to build a airplane and test something.
Writing A Statement of the Problem for the Experiment What should it state? It should state:“The Effect of the Independent Variable on the Dependent Variable”. A good statement of the problem for “The airplane would be The Effect of wing length on time of decent
More about our variables: The independent variable is the variable that is purposely changed. It is the manipulated variable. The dependent variable changes in response to the independent variable. It is the responding variable. What is the “airplane” independent variable? length of one wing as measured in centimeters What is the dependent variable? time of descent as measured in seconds
Title for the airplane Experiment The Effect of Wing Length on the Length of Time the airplane Takes to Reach the Ground
Another Look at Our Hypothesis INDEPENDENT VARIABLE If the length of the wings are increased, DEPENDENT VARIABLE then time of descent will increase.
Constants in an Experiment Factors that are kept the same and not allowed to change What should be kept constant in the“airplane”? CONSTANTS Same structure of airplanes Same dropping technique Same dropping height
Values of the Independent Variable How many different values of the independent variable should we test? Enough to clearly illustrate a trend in the data - 5cm, 6cm, 7cm, 8cm…..
Repeated Trials How many repeated trials are needed in the “airplane”? At least 3, then calculate an average value for each level of the independent variable
Drawing of Experiment Hold airplane in the middle Drop from same spot each time
Qualitative Observations and Results • As we dropped the airplane, we observed that sometimes they seemed to be affected by air currents. • It appeared that airplanes with longer wingspans took a greater time to reach the ground
Quantitative Observations Data Table, Graph and Statistics
Sample Data Table Title: The Effect of wing length on the time of descent Descent Time (s) Trials Wing Length (cm) Average Descent Time (s) 1 2 3 5 6 7 8 9 3 5 4 4 4 5 6 5 6 7 5 6 7 8 6 7 9 7 8 8
Analysis and Interpretation of Results While individual trial results showed some variation; overall, as average wing length increased from 5 through 9 centimeters, average time of descent also increased from 4 through 8 seconds. This shows a direct correlation.
Possible Experimental Errors Although the average results supported the hypothesis, the individual trial results showed some variation. Some possible reasons for this could be due to air currents in the room or reaction time differences between the timer and the airplane dropper.
Conclusion The overall results supported the hypothesis. A possible reason for this could be due to increased surface area of the wing in contact with the air - allowing for greater air support.
Recommendations for Further Experimentation/ Practical Applications Increased time of descent due to greater wing length suggests that increased wing length could lead to greater fuel efficiency of an actual airplane. Other experiments investigating factors that would contribute to greater descent time might include: making modifications in the shape of the wings, changing the number of wing blades, and making folds in the wing blades
What kind of question would you ask? • Materials provided: sugar, stir sticks, access to warm and cold water and ice, thermometers, beakers, object that floats partially submerged in water, graph paper, jumbo paper clip, straws, rulers, protractor • Come up with a question related to solutions
Possible Questions • effects of temperature on solubility • effects of concentration on depth object sinks in solution • effects of stirring on solubility • effects of concentration on height of solution rising in straw • effect of amount of sugar dissolved on temperature of solution • effect of temperature on how long a set amount of sugar required to dissolve
Possible Hypotheses • If we raise the temperature then the solubility will ??? • If we increase the sugar concentration then the height of solution rising in the straw will ??? • If we dissolve more sugar in the solution then the temperature will ???
實驗目的 • 透過實驗設計的手法,找出影響紙蜻蜓滯空時間的顯著因子,並依實驗結果分析各因子應該如何安排才能使紙蜻蜓的滯空時間最長。
問題描述 • 影響紙蜻蜓滯空時間的因子有很多(如圖1所示),最重要的因子如下: • The length of wing (L):紙蜻蜓機翼的長度。 • The width of wing (W):紙蜻蜓機翼的寬度。 • The length of connection (C):連接機翼與尾部的長度。 • The length of tail (T):尾部的長度。 • The width of tail (S):尾部的寬度。 • Number of clips (N):加在紙蜻蜓尾部的迴紋針數。
問題描述 圖一
實作: 紙飛機實驗設計 1, 問題:如何設計可讓該紙飛機自固定高度(250cm) 垂直鬆手放下後, 能於空中停留時間最久 2, 3 ~ 5人一組 3, 工作分配, 組長 : 負責各組工作分派 4, factors : 翼長,柄長,柄寬,迴紋針數量 5, 請選擇3因子進行23 因子實驗,每種組合重複三次,收集數據 6, 利用 Minitab 分析結果 7, 請討論何者為重要因子 8, 確認實驗
實作: 紙飛機實驗設計 1, 問題:如何設計可讓該紙飛機自固定高度(250cm) 垂直鬆手放下後, 能於空中停留時間最久 2, 3 ~ 5 人一組 3, 工作分配, 組長 : 負責各組工作分派 4, factors : 翼長,柄長,柄寬,迴紋針數量 5, 請利用 2 4-1 部分因子實驗,每種組合重複三次,收集數據 6, 利用 Minitab 分析結果 7, 請討論何者為重要因子 8, 確認實驗