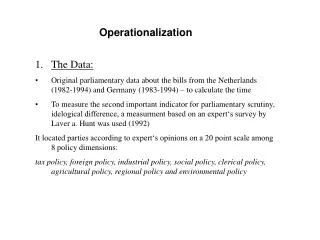
Operationalization and Measurement
Operationalization and Measurement. The Research Process Select Topic Review Literature Clarify Concepts and Measures. The next step after selecting a topic and finding out what is known about the topic.

Operationalization and Measurement
E N D
Presentation Transcript
Operationalization and Measurement The Research Process Select Topic Review Literature Clarify Concepts and Measures The next step after selecting a topic and finding out what is known about the topic. In order to develop a variable that captures the phenomenon of interest must first decide how you will meaningfully record its variation in the real world. Measurement
Topics to be considered: • Concepts • The process of moving from concepts to variable • Operational definitions • Dimensions • Indicators • Measurement • Assessment of measures • Reliability • Validity • Variables • Types of variables • Levels of measurement • Indices and scales
Concepts • The phenomenon of interest to the researcher. • Abstract idea • Everyday life • Social science theory • Behavior • Thing • Must decide what you mean by the concept. • Definition • Dimensions and Domain • Must decide how you will recognize a manifestation of the concept in the real world. • Indicators
Goals of Measurement • Good measurement captures variation in an operationally defined variable. • It is a means to an end. • If the measurement does not adequately capture the phenomenon of interest then all the researcher has at the end of the study is garbage, no matter how good the sample or the hypotheses.
Important Steps to Defining a Concept: • Decide what it is you are interested in by reviewing the literature. • Decide what aspect of the phenomenon in question you want to empirically observe that will accomplish the purpose of your study. • Operational definition = specifying ways to measure a concept once it has been fully defined theoretically. • Steps to operationalization of concepts • Determine dimensions of concepts = different qualities or parts of the concept. Each unique dimension is also said to be a domain. A concept can be unidimensional or multidimensional. • Develop multiple indicators for each dimension. Indicators are observable phenomenon that can be used to measure dimensions of a concept.
Defining Measurement The process of assigning numbers according to rules of correspondence between definition and observation. • Activity of assigning numbers • Activity for assigning the numbers must follow rules: • Rules of correspondence • The number/indicant assigned to an observations should correspond meaningfully to the event or phenomenon. • Organizes the empirical data in some systematic way to the concept being studied.
Assessing Measures • Measurement Error • All measurement leads to some error. • Observed measure = true score + error • Cannot eliminate all error in measurement. Goal is to reduce error as much as possible. • Social science research is especially concerned with systematic error. • Random error impacts the reliability of a measure but it is easier to deal with statistically and through the use of multiple indicators for the same measure.
The Goodness of Measures Assessed by determining the validity and reliability of the measure. Validity Reliability The measure is measuring the concept the researcher thinks it is measuring. The measure produces the same outcomes over repeated observations.
Validity • Validity depends on correspondence between a concept and the empirical indicators that are supposed to measure it. • It addresses the relationship between concept and indicator • A measure can be reliable and not be valid and visa versa.
Types of Validity • Content Validity • Face validity • Careful consideration that the measuring instruments capture the underlying concept • Do the indicators capture the full domain of meaning of the concept • Sampling validity • The indicators sample fairly from each of the various domains of the concept • Difficult to empirically establish content validity especially for abstract concepts. Requires agreement in the discipline about the full domain and meaning of the concept.
Types of Validity • Criterion Related Validity • A test of validity in which the variable being examined is correlated with another variable that it should be logically related to. (simple Correlation) • Predictive Validity • When the test of validity for the measure is to show that it can predict some future outcome. • Concurrent Validity • The test of validity is to show that the measure is related to some other factor that occurs at the same time as the measure of interest. • The measure must be related to some variable that can serve as proof that the measure is measuring what it is supposed to be measuring.
Types of Validity • Construct Validity • Used with theoretical concepts where there is little agreement about the underlying dimensions of the concept or about other measures that should be associated with the concept. • Test Validity by generating hypotheses about the concept being measured, test the hypotheses, and then correlate the results with the initial measure. • Examine theory about concept to determine what the underlying concept that you are trying to measure is related to. • Examine the relationship between the indicators for the concept. • Interpret results of correlation among indicators in a manner that it clarifies issues of validity about the concept. • It is useful to have multiple indicators that correlate as hypothesized to strengthen arguments about construct validity.
Reliability • The degree to which the measure produce consistent results over repeated observations. • Characteristics of indicators used to measure a concept that may effect reliability. • Indicators or topic(s) that raise concern about social desirability • Subjects lack of familiarity with subject • Complicated wording or sentences on indicators
Reliability • In testing reliability must determine the degree of random error to systematic error. • Random error tends to cancel itself out over repeated measures and subjects. • If use a greater number of indicators and then use a composite measure then reduce random error. • Types of reliability tests • Stability Measure/Test-retest reliability • Measures stability of an item over time. • Measures of Equivalence • Compare parallel items at same point and time. • Requires two or more indicators measuring same concept or domain of the concept. • Estimate reliability through correlation of indicators
Types of Variables • Can measure variables in two general ways: • Categorical • Variable made-up of a set number of categories that do not represent a numerical measure. May assign number to responses but they are meaningless. • Numerical • Variable that is measured in a numerical scale, where each unit is assigned a numerical value that is meaningful.
Categorical Variables • The categories must conform to two rules: • The categories must be mutually exclusive • The categories must be exhaustive
Numerical Variables • Numbers representing responses for a numerical variable can be • Discrete • Cannot break down the number into smaller units • Continuous • Can break down the numbers into smaller and smaller units.
Levels of Measurement • A variable can often be measured at different levels. • The level of measurement selected for variables impacts the quality of the data. • Levels of Categorical Variable • Nominal • Ordinal • Levels of Numerical Varaibles • Interval • Ratio
Levels of Categorical Variables • Nominal • Categories can’t be ordered from hi to lo • Must have at least two categories • Ordinal • Have two or more categories as responses • Response categories can be ordered • The distance in response categories not indicated by its numerical representation. • Sometimes treated as numerical, particularly when response categories for indicator establish level of agreement.
Levels of Numerical Variables • Interval Measures • Has separate categories • Categories can be ordered • The distance between numerical categories can be established mathematically and are meaningful. • No true zero point • Often used in scales which are composite of multiple indicators. • Ratio Measures • All the qualities above • Has a true zero point
Index and Scales • Index • A composite measure developed to represent different dimensions of a concept. • Considers only how each item is measured. • Can be simple additive or averages as well as other possibilities. • Scale • A composite measure which includes some aspect of the intensity structure of the interrelations between indicators. • Considers how indicators are related to one another and underlying concept
Characteristics of Scales • Attempt is made to determine a pattern that best makes sense of indicators and their interrelations • Guttman Scales • The scale is unidimensional • Responses form an expected pattern such that response to subsequent items subsumes response to previous items.
Commonly Used Scales and Indices • Occupational Prestige Scales • Measures level of prestige associated with occupations. • Duncan Socioeconomic Index • A composite measure that includes more than prestige to measure overall success.