Tips and tricks for performing standard meta-regression analysis with SPSS
120 likes | 711 Vues
Tips and tricks for performing standard meta-regression analysis with SPSS. Giuseppe Biondi Zoccai Division of Cardiology, Department of Internal Medicine, University of Turin, Turin, Italy Meta-analysis and Evidence-based medicine Training in Cardiology (METCARDIO), Turin, Italy.

Tips and tricks for performing standard meta-regression analysis with SPSS
E N D
Presentation Transcript
Tips and tricks for performing standard meta-regression analysis with SPSS Giuseppe Biondi Zoccai Division of Cardiology, Department of Internal Medicine, University of Turin, Turin, ItalyMeta-analysis and Evidence-based medicine Training in Cardiology (METCARDIO), Turin, Italy
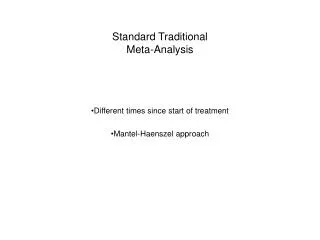
Some bare facts • A meta-regression analysis is a type of statistical analysis exploiting datasets build during systematic reviews • It quantitatively explores interactions between a given effect (eg the risk of an event in patients treated with A vs B, as expressed with odds ratios) and a moderator or covariate of interest (eg prevalence of diabetes mellitus in each study) • The key aspect of meta-regression is that each single study is given a specific weight which corresponds to its precision and/or size (to performed a weighted least squares [WLS] linear regression)
Building your dataset • To perform a standard (fixed-effect) meta-regression analysis with SPSS, it is crucial to compute and extract from each individual study: • Natural log of odds ratios (OR): ln OR • Standard error (SE) of OR (or √variance) • Variance of OR (or SE2) • Inverse of variance: 1/variance • Sample size: N • Moderators (ie covariates or independent variables) of interest (eg prevalence [in %] of diabetes mellitus [DM] in each study)
Building your dataset Ln OR Moderator or covariate (eg DM) Sample size Inverse of variance
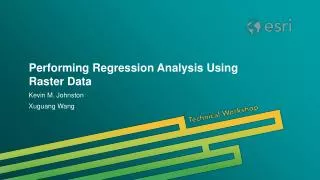
Analysis with SPSS Dependent variable (ln OR) Moderator or covariate (eg DM) Inverse of variance
Results with SPSS P value for interaction Beta (meta-regression coefficient)
Reporting results • In our example, we can conclude that we found a significant interaction between the treatment of interest vs the comparator (expressed as ln OR) and the prevalence of diabetes (beta=-6,9, p<0.001). • Thus treatment A becomes significantly more beneficial than treatment B with an increasing prevalence of diabetes
Further details • Any SPSS version can be used (eg 11.0 [the version used in these examples] to 16.0) • In selected cases, sample size can be used instead of the inverse of variance as weight for the regression analysis (yielding in this example beta=-6.1, p=0.018) • This type of meta-regression is based on a fixed-effect method, but other approaches are needed for a random-effect meta-regression (eg GLM) • Examples of similar meta-regression analyses: • Biondi-Zoccai et al, American Heart Journal 2005;149:504-11 • Biondi-Zoccai et al, American Heart Journal 2007;153:587-93 • Biondi-Zoccai et al, American Heart Journal 2008;155:1081-9
For any correspondence: gbiondizoccai@gmail.comFor further slides on these topics feel free to visit the metcardio.org website: http://www.metcardio.org/slides.html