Download
1 / 13
130 likes | 204 Vues
Explore academic job trends using geospatial visualizations to provide detailed overviews, trend analysis, and encourage interventions. Identify patterns in high-quality data sets for informed decision-making.

E N D
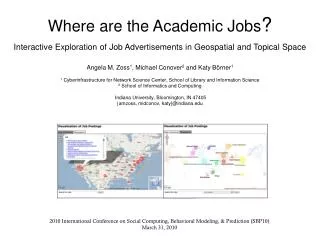
Where are the Academic Jobs? Interactive Exploration of Job Advertisements in Geospatial and Topical SpaceAngela M. Zoss1, Michael Conover2 and Katy Börner11 Cyberinfrastructure for Network Science Center, School of Library and Information Science2 School of Informatics and Computing Indiana University, Bloomington, IN 47405{amzoss, midconov, katy}@indiana.edu 2010 International Conference on Social Computing, Behavioral Modeling, & Prediction (SBP10) March 31, 2010
Complex phenomena can be affected by many interrelated systems. How can we obtain both a broad overview and a more detailed understanding? External Events WWI Crash of ‘29 WWII SBP10 Zoss – Interactive Job Visualizations 2/13
Challenges and Opportunities • Increases in size and complexity of data sets require new techniques of summary and representation. • These techniques are critical when data have high social impact, like employment data during times of economic turmoil. • Visualization of such data can: • provide overviews and details of complex phenomena, • facilitate trend analysis, and • encourage new reactions and interventions in response to system behavior. • Users include both those who will interact directly with the low-level data (e.g., job seekers) and those who will analyze and respond to changes in high-level data (e.g., policy makers). SBP10 Zoss – Interactive Job Visualizations 3/13
Related Work Real-Time Data Analysis and Interactive Visualizations (See paper for references.) SBP10 Zoss – Interactive Job Visualizations 4/13
Related Work Job Market Data Analysis and Visualizations http://flare.prefuse.org/apps/job_voyager http://www.slate.com/id/2216238/ http://www.nytimes.com/2009/03/07/business/economy/07jobs.html http://projects.flowingdata.com/america/unemployment/ SBP10 Zoss – Interactive Job Visualizations 5/13
Data Sets • Effective visualizations depend on high quality, well-structured data. • High value data sets will preserve as much of the complexity of phenomena as possible. • Trend analysis and interactivity are best supported by data that are continually updated. SBP10 Zoss – Interactive Job Visualizations 6/13
Data Preparation and Analysis Nature.com Job Postings Location Text Description Levels on Geospatial Map Levels on Map of Science SBP10 Zoss – Interactive Job Visualizations 7/13
Geospatial Visualization • We leverage Google maps as a well-known navigation tool. • The map has customized levels of detail depending on zoom level. • We add interactivity by giving markers an “information window” that shows what job postings are connected to that location. SBP10 Zoss – Interactive Job Visualizations 8/13
Geospatial Visualization SBP10 Zoss – Interactive Job Visualizations 9/13
Map of Science Visualization • The UCSD Map of Science represents scientific fields as large network. • The map was created using text and bibliographic data from journal publications. • The network has 554 nodes (e.g., “plant physiology”), each of which is a subdomain of 13 top-level scientific disciplines (e.g., “Earth Science”). • Each node is also described by keywords, which can be matched to other texts. SBP10 Zoss – Interactive Job Visualizations 10/13
Map of Science Visualization SBP10 Zoss – Interactive Job Visualizations 11/13
Discussion and Outlook • Using common navigation metaphor for multiple access points reduces barriers to exploration, analysis, and synthesis. • Interactivity reduces data overload by enabling users to selectively expand elements. • Using geospatial and topical representations of job data creates a unique opportunity to examine the activity of fields of science. • Planned improvements include adding continuously updated, robust data sets; optimizing text matching algorithms; and incorporating timeline control. SBP10 Zoss – Interactive Job Visualizations 12/13
Questions? Angela Zoss amzoss@indiana.edu Site: http://cns-nd3.slis.indiana.edu/mapjobs/ Paper: http://ivl.slis.indiana.edu/km/pub/zoss-et-al-jobmaps.pdf This work is funded in part by the National Science Foundation under grant IIS-0715303 and the National Institutes of Health under grants RM-07-004 and 1U24RR029822-01. Any opinions, findings, and conclusions or recommendations expressed in this material are those of the author(s) and do not necessarily reflect the views of the National Science Foundation. SBP10 Zoss – Interactive Job Visualizations 13/13