
Term Project:
E N D
Presentation Transcript
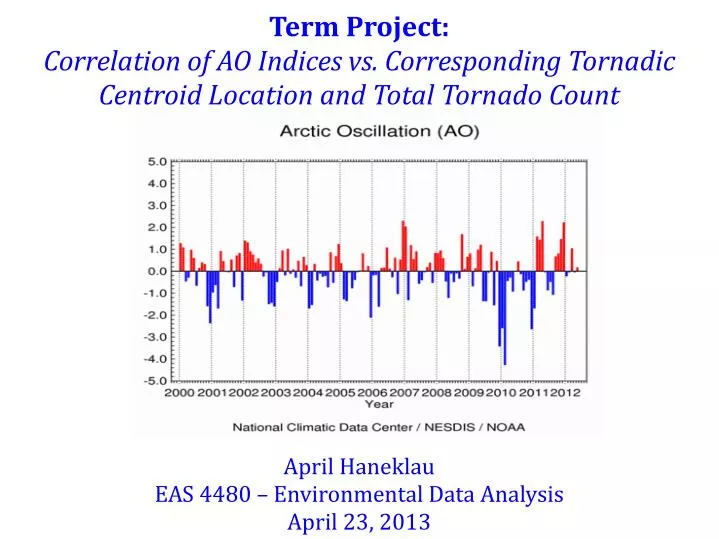
Term Project: Correlation of AO Indices vs. Corresponding Tornadic Centroid Location and Total Tornado Count April Haneklau EAS 4480 – Environmental Data Analysis April 23, 2013
Introduction • Idea: • Positive AO • = • Tornadic Activity Cold air Reason: Warmer temperatures ⟹ Sharper temperature gradients Warm air
Overview • Analyzing correlation between AO indices and tornadic activity of April of each year. • Monthly = 1990-2012. • Daily = 2000-2012 April 2011! • Data collected from NCDC Storm Events Database and CPC Teleconnection Archives.
Primary Calculations • Weighted Average: • From daily storm reports, a weighted average (by EF/F rating) latitude and longitude value was calculated for each year's April. • Purpose: to show location of centroid of tornadic activity • Correlation Coefficient & Least-Squares Regression • Calculated the correlation and least-squares regression between AO and monthly weighted latitudes & longitudes, monthly tornado count and daily tornado count. • Periodogram • Calculated and plotted periodogram of monthly weighted latitudes & longitudes, monthly tornado count, daily tornado count, monthly AO indices and daily AO indices. • Purpose: to identify possible cycles. • Covariance & CPSD • Calculated cross power spectral density to identify possible shared cycles observed in periodogram. • Calculated lag time from covariance of daily data to identify lag between observed AO & tornadic activity.
Weighted Average Calculation April 2011!
Daily Variables Correlation Coefficient & Lag • Monthly Variables Significant!
Least-Squares Regression North East South West April 2011!
Houston, we have a problem... • Tornado rating scale changed from F to EF in 2007. Thus, weights could potentially be slightly skewed. • Data not well obtained/archived before 2000; 107 days in 1990's had incomplete data and were excluded from calculations. • Only analyzed 23 years; likely would see significant or real peaks with larger dataset.