Download
1 / 28
280 likes | 500 Vues
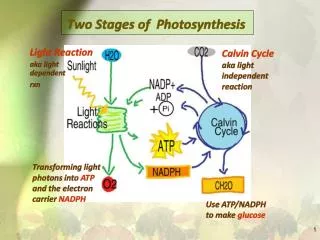
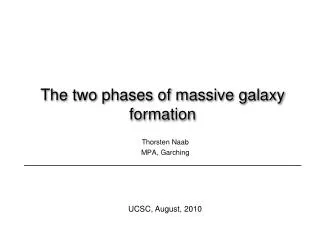
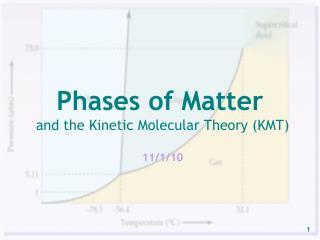
Two phases of photosynthesis. Light reaction (theoretically, minimal of 8 photons necessary for each molecule of O 2 ) 2H 2 O 4H + + 4e - + O 2 Dark reaction (using the energy transferred from the light reaction to NADPH and ATP) CO 2 + 4H + + 4e - [CH 2 O] + H 2 O.

E N D
Two phases of photosynthesis Light reaction (theoretically, minimal of 8 photons necessary for each molecule of O2) 2H2O 4H+ + 4e- + O2 Dark reaction (using the energy transferred from the light reaction to NADPH and ATP) CO2 + 4H+ + 4e- [CH2O] + H2O
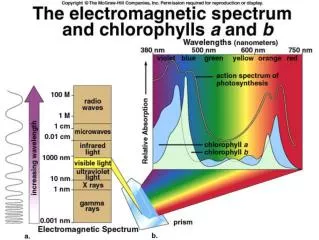
How to Measure Photosynthetic Rates Photosynthetic rates = Assimilation rate (A) A = CO2 uptake per unit leaf area per unit time [µmol CO2 m-2 s-1] = O2 release rate unit leaf area per unit time [µmol O2 m-2 s-1] Measurement with infrared gas analyzer A = Change in CO2 concentration x flow rate / leaf area
A = (CO2ref - CO2sample) x flow rate / leaf area Infrared gas analyzer (IRGA) is used for measurements of concentration of CO2 and H2O. In CO2 uptake measurement, respiration is expressed as negative number Ref Air Sample air
Net Assimilation and NPP Leaf level (per unit leaf area or per unit leaf mass) Net photosynthetic rate = Gross photosynthetic rate – respiration rate Plant level (per unit plant mass) Net photosynthetic rate = (Gross photosynthetic rate by all leaves – respiration by all tissues)/ (plant mass) Community level (per unit area of ground) Net primary productivity = Gross primary production – respiration by all plants
NPP vs. NEP • NPP = Net Photosynthetic Rate (per leaf area) x Leaf Area Index – Total Plant Respiration • Net Ecosystem Productivity = NPP – Respiration by non-photosynthetic organisms. • Challenge how to accurately estimate the respiration, especially by roots?
How to estimate NPP or NEP? • Measurement of biomass accumulation • Below-ground biomass increment? • Loss to herbivores (usually < 20 % of above ground NPP)? • Biased sampling by ecologists (who likes “nice” stands). • Measurement of eddy covariance that estimate vertical CO2 flux (and estimation of NEP) • Many assumptions, including homogeneous smooth canopy, must be made. • Respiration reflect not only plants, but of all others • Estimation from leaf area index with remote sensing (LANDSAT or AVHRR) • Must assume of net photosynthetic rate (and respiration) per unit leaf area, which may be inadequate.
Measuring productivity from biomass change with time Osborn Fig. 3.7
Factors that affect NPP • Leaf area index (LAI) • The total leaf area over a unit area of ground • Soil nutrient availability • It affects LAI and rates of photosynthesis and respiration per unit leaf area. • It is affected by parental rock, its age, climate, and plants. • Temperature • Along the latitudinal gradient, mean annual temperature gives rough (but good enough?) correlation. • Seasonal change in temperature matter, but interaction with water availability. • Water availability (precipitation, topography) • But, what is the appropriate temporal resolution to integrate water availability?
NPP vs. LAI (from Schlesinger 1997)
NPP vs. MAT (from Schlesinger 1997)
NPP vs. Precipitation (from Schlesinger 1997)
Global NPP (g C m-2 yr-1) (from Field et al. 1998) Ocean accounts almost ½ of the global total NPP.
Petagrams (1015 g) of Carbon: Global annual carbon budget. • Global terrestrial NPP ≈ 60 x 1015 g (Schlesinger 1997) • Ocean NPP = 48.5 x 10¹⁵ g • Terrestrial NPP = 56.4 x 10¹⁵ g (Field et al. 1998)
Human impacts on NPP and NEP • Perhaps global land NPP has been depressed by 25-40 % by conversion of land by humans. • Harvested by humans = 3.3 x 10¹⁵ g • Consumed by non-human herbivores = 3 x 10¹⁵ • Consumed by fire = 2 to 5 x 10¹⁵ g • Reduction of world standing biomass since 1860 = 110 x 1015 g = 13 % of pre-industrial biomass (Houghton et al. 1993)
Missing carbon sink: Hypotheses CO2 fertilization effects (Field 2001) Regrowth of secondary forests (Malhi & Grace 2000) Fire suppression (Tilman et al. 2000) Agricultural practice to increase organic matter inputs (Houghton et al. 1999). Increased sedimentation in the deep ocean floors permanently buries carbon (Stallard 2001).
CO2 fertilization effects: Problems • The missing sink is too large to be explained by this effect alone. • The CO2 fertilization effects often disappear due to other limitations, such as soil nutrient availability, potential LAI, etc. • Increased photosynthesis accompanied by increased respiration, changes in competition among species and community composition shifts, etc.
Effects of secondary forest regrowth (from Schlesinger 1997)
Effects of fire and grazing on standing biomass dynamics in savanna grassland From Osborn (2000)
Effects of a dry season fire on (a) soil water contents (b) and above ground NPP From Osborn (2000)
Tropical forest and savannas may have even greater NPP (60% or 35 Pg per year)
Soil Carbon: How do CH2O gets buried over a long term? Short-term pool: Litter decomposes exponentially. Fraction of litter remaining = e-k Long-term pool: humus and other soil organic matter(SOM)
Total Soil Carbon≈ 1500-2000 Pg • ≈ 0.04 % of the O2 content in the atmosphere • Long-term storage cannot be on land but anoxic marine sediment • SOM represents a huge potential pool from which CO2 may be released catastrophically
In most biomes (except for tropical humid forests), buried soil carbon exceeds the total above-ground live and dead biomass.