Download
1 / 141
1.43k likes | 1.69k Vues
Detection of Fraud. Digital Analysis. Patterns Using. May 16, 2008. Session objectives. Understand why and how Understand statistical basis for quantifying differences Identify ten general tools and techniques Understand use of Excel How pattern detection fits in. Overview.

E N D
Detection ofFraud Digital Analysis Patterns Using May 16, 2008
Session objectives • Understand why and how • Understand statistical basis for quantifying differences • Identify ten general tools and techniques • Understand use of Excel • How pattern detection fits in
Overview • Fraud patterns detectable with digital analysis • Basis for digital analysis approach • Usage examples • Continuous monitoring • Business analytics • Using Excel
Objective 1 The Why and How • Three brief examples • IIA Guidance Paper • Auditors “Top 10” • Process Overview • Who, What, Why, When & Where
Objective 1a Example 1Wake County Transportation Fraud • Supplier Kickback – School Bus parts • $5 million • Jail sentences • Period of years
Objective 1a Too little too late • Understaffed internal audit • Software not used • Data on multiple platforms • Transaction volumes large
Objective 1a Preventable • Need structured, objective approach • Let the data “talk to you” • Need efficient and effective approach
Example 2 Objective 1a Cost of six types of AIDS drugs
Objective 1a Example 2 Typical Prescription Patterns
Example 2 Objective 1a Prescriptions by Dr. X
Example 2 Objective 1a Off-label use • Serostim • Treat wasting syndrome, side effect of AIDS, OR • Used by body builders for recreational purposes • One physician prescribed $11.5 million worth (12% of the entire state)
Example 3 Objective 1a Revenue trends
Example 3 Objective 1a Dental Billings
Objective 1b Guidance Paper • A proposed implementation approach • “Managing the Business Risk of Fraud: A Practical Guide” http://tinyurl.com/3ldfza • Five Principles • Fraud Detection • Coordinated Investigation Approach
Objective 1b Managing the Business Risk of Fraud: A Practical Guide • Exposure draft of IIA, AICPA and ACFE • Exposure draft issued 11/2007 • Section 5 – Fraud Detection
Objective 1b Section 5 – Fraud Detection • Detective Controls • Process Controls • Anonymous Reporting • Internal Auditing • Proactive Fraud Detection
Objective 1b Proactive Fraud Detection • Data Analysis to identify: • Anomalies • Trends • Risk indicators
Objective 1b Specific Examples Cited • Journal entries – suspicious transactions • Identification of relationships • Benford’s Law • Continuous monitoring
Objective 1b Data Analysis enhances ability to detect fraud • Identify hidden relationships • Identify suspicious transactions • Assess effectiveness of internal controls • Monitor fraud threats • Analyze millions of transactions
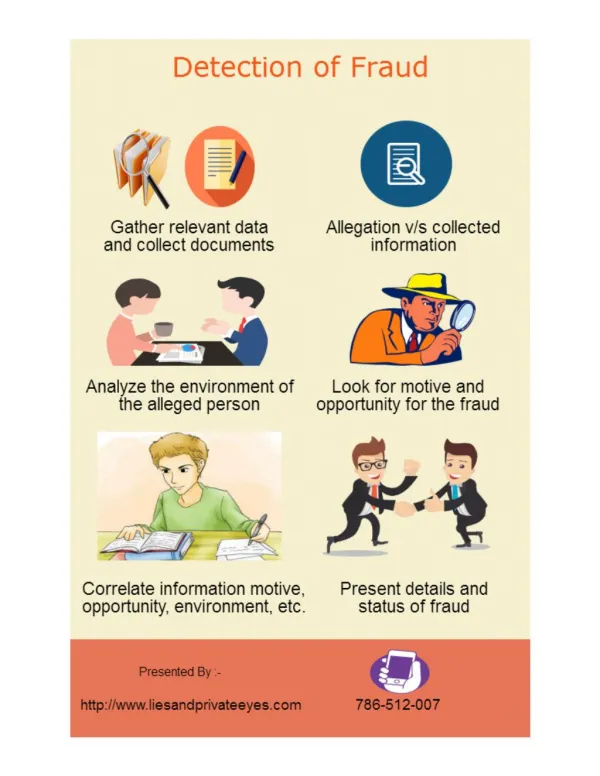
Objective 1c Peeling the Onion
Objective 1d Fraud Pattern Detection
Objective 1e Digital Analysis (5W) • Who • What • Why • Where • When
Objective 1e Who Uses Digital Analysis • Traditionally, IT specialists • With appropriate tools, audit generalists (CAATs) • Growing trend of business analytics • Essential component of continuous monitoring
Objective 1e What - Digital Analysis • Using software to: • Classify • Quantify • Compare • Both numeric and non-numeric data
Objective 1e How - Assessing fraud risk • Basis is quantification • Software can do the “leg work” • Statistical measures of difference • Chi square • Kolmogorov-Smirnov • D-statistic • Specific approaches
Objective 1e Why - Advantages • Automated process • Handle large data populations • Objective, quantifiable metrics • Can be part of continuous monitoring • Can produce useful business analytics • 100% testing is possible • Quantify risk • Repeatable process
Objective 1e Why - Disadvantages • Costly (time and software costs) • Learning curve • Requires specialized knowledge
Objective 1e When to Use Digital Analysis • Traditional – intermittent (one off) • Trend is to use it as often as possible • Continuous monitoring • Scheduled processing
Objective 1e Where Is It Applicable? • Any organization with data in digital format, and especially if: • Volumes are large • Data structures are complex • Potential for fraud exists
Objective 1 Objective 1 Summarized • Three brief examples • IIA Guidance Paper • “Top 10” Metrics • Process Overview • Who, What, Why, When & Where
Objective 1 - Summarized • Understand why and how • Understand statistical basis for quantifying differences • Identify ten general tools and techniques • Understand use of Excel • How pattern detection fits in Next is the basis …
Objective 2 Basis for Pattern Detection • Analytical review • Isolate the “significant few” • Detection of errors • Quantified approach
Objective 2 Understanding the Basis • Quantified Approach • Population vs. Groups • Measuring the Difference • Stat 101 – Counts, Totals, Chi Square and K-S • The metrics used
Objective 2a Quantified Approach • Based on measureable differences • Population vs. Group • “Shotgun” technique
Objective 2a Detection of Fraud Characteristics • Something is different than expected
Objective 2b Fraud patterns • Common theme – “something is different” • Groups • Group pattern is different than overall population
Objective 2c Measurement Basis • Transaction counts • Transaction amounts
Objective 2d A few words about statistics • Detailed knowledge of statistics not necessary • Software packages do the “number-crunching” • Statistics used only to highlight potential errors/frauds • Not used for quantification
Objective 2d How is digital analysis done? • Comparison of group with population as a whole • Can be based on either counts or amounts • Difference is measured • Groups can then be ranked using a selected measure • High difference = possible error/fraud
Objective 2d Histograms • Attributes tallied and categorized into “bins” • Counts or sums of amounts
Objective 2d Two histograms obtained • Population and group
Objective 2d Compute Cumulative Amount for each
Objective 2d Are the histograms different? • Two statistical measures of difference • Chi Squared (counts) • K-S (distribution) • Both yield a difference metric
Objective 2d Chi Squared • Classic test on data in a table • Answers the question – are the rows/columns different • Some limitations on when it can be applied
Objective 2d Chi Squared • Table of Counts • Degrees of Freedom • Chi Squared Value • P-statistic • Computationally intensive
Objective 2d Kolmogorov-Smirnov • Two Russian mathematicians • Comparison of distributions • Metric is the “d-statistic”
Objective 2d How is K-S test done? • Four step process • For each cluster element determine percentage • Then calculate cumulative percentage • Compare the differences in cumulative percentages • Identify the largest difference
Objective 2d - KS Kolmogorov-Smirnov
Objective 2e Classification by metrics • Stratification • Day of week • Happens on holiday • Round numbers • Variability • Benford’s Law • Trend lines • Relationships (market basket) • Gaps • Duplicates
Objective e Auditor’s “Top 10” Metrics • Outliers / Variability • Stratification • Day of Week • Round Numbers • Made Up Numbers • Market basket • Trends • Gaps • Duplicates • Dates