Download
1 / 49
490 likes | 610 Vues
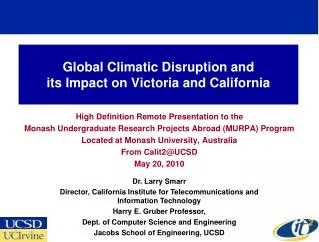
Sustainable Computing and Telecom Can Contribute to Limiting Global Climatic Disruption. Invited Seminar AT&T Shannon Labs Florham Park, NJ July 28, 2010. Dr. Larry Smarr Director, California Institute for Telecommunications and Information Technology Harry E. Gruber Professor,

E N D
Sustainable Computing and Telecom Can Contribute to Limiting Global Climatic Disruption Invited Seminar AT&T Shannon Labs Florham Park, NJ July 28, 2010 Dr. Larry Smarr Director, California Institute for Telecommunications and Information Technology Harry E. Gruber Professor, Dept. of Computer Science and Engineering Jacobs School of Engineering, UCSD
Abstract The Copenhagen Summit concluded that greenhouse gas emissions must be reduced in the coming decade if we are to limit global warming to 2 degrees C (The Earth has warmed ~0.8 degrees C since pre-industrial times). The International Energy Agency has shown what a radical challenge such a reduction will be for the global energy sector, but any solution requires increasing energy efficiency in electrical devices. The Information and Communication Technology (ICT) industry's Smart 2020 study reveals that the ICT industry produces ~2-3 percent of global greenhouse gas emissions. Furthermore, the ICT sector’s emissions will nearly triple, in a business-as-usual scenario, from 2002 to 2020. On the other hand, the Climate Group estimates that transformative applications of ICT to electricity grids, logistic chains, intelligent transportation and building infrastructure, and other social systems can reduce global greenhouse gas emissions by about 15 percent— five times ICT’s own footprint! I will give results on several Calit2 affiliated projects aimed at increasing ICT energy efficiency, including for individual PCs, from the NSF-funded GreenLight Project (http://greenlight.calit2.net), deployed at UCSD, which creates an instrumented data center, to cellular base stations. At a higher level, we are using the two Calit2 university campuses (UC San Diego and UC Irvine) themselves as at-scale Green IT testbeds. Campuses are functionally small towns with their own power grids, commuter transportation systems, hospitals, and populations in the tens of thousands. Calit2 is working with campus administration, faculty and staff to instrument these campuses as Living Laboratories of the Greener Future.
Accelerating Increase in the Greenhouse Gas CO2Since Industrial Era Began Source: David JC MacKay, Sustainable Energy Without the Hot Air (2009) 388 ppm in 2010 316 ppm in 1960 Medieval Warm Period Little Ice Age 290 ppm in 1900 280 ppm in 1800
Global Average Temperature Per DecadeOver the Last 160 Years June 2010 Hottest Since Records Began in 1880 - National Oceanic and Atmospheric Administration www.noaanews.noaa.gov/stories2010/20100715_globalstats.html
Limit of 2o C Agreed to at the UN Climate Change Conference 2009 in Copenhagen “To achieve the ultimate objective of the Convention to stabilize greenhouse gas concentration in the atmosphere at a level that would prevent dangerous anthropogenic interference with the climate system, we shall, recognizing the scientific view that the increase in global temperature should be below 2 degrees Celsius, on the basis of equity and in the context of sustainable development, enhance our long-term cooperative action to combat climate change.” --the Copenhagen Accord of 18 December 2009
However, Current Global Emission Reduction Commitments Imply ~4o C Temperature Rise Since 1780, Earth has Warmed 0.8o C and CO2 is at 390ppm • According to the MIT C-ROADS model: • Continuing business as usual would lead to an expected temperature increase of 4.8 °C (8.6 ° F) (CO2 950ppm). • But even if all the commitments for emissions reductions made by individual nations at the Copenhagen conference were fully implemented, the expected rise in temperatures is still 3.9 °C (7.0 °F) above preindustrial levels (CO2 770ppm). • To stabilize atmospheric concentrations of greenhouse gases and limit these risks, Sterman says that global greenhouse gas emissions must peak before 2020 and then fall at least 80% below recent levels by 2050, continuing to drop by the end of this century until we have a carbon neutral economy. Doing so might limit the expected warming to the target of 2 °C (3.6 °F) (CO2 450ppm). http://mitsloan.mit.edu/newsroom/2010-sterman.php
Atmospheric CO2 Levels for Last 800,000 Yearsand Several Projections for the 21st Century ~SRES A2 2100 No Emission Controls--MIT Study 2100 Post-Copenhagen Agreements-MIT Model ~SRES B1 2100 Shell Blueprints Scenario 2100 Ramanathan and Xu and IEA Blue Scenario Source: U.S. Global Change Research Program Report (2009) Graph from: www.globalchange.gov/publications/reports/scientific-assessments /us-impacts/download-the-report
IEA BLUE--A Global Energy System ScenariosFor Limiting CO2 to 450ppm “The next decade is critical. If emissions do not peak by around 2020 and decline steadily thereafter, achieving the needed 50% reduction by 2050 will become much more costly. In fact, the opportunity may be lost completely. Attempting to regain a 50% reduction path at a later point in time would require much greater CO2 reductions, entailing much more drastic action on a shorter time scale and significantly higher costs than may be politically acceptable.”
To Cut Energy Related CO2 Emissions 50% by 2050Requires a Radically Different Global Energy System Doubled Halved IEA BLUE Map Scenario: Abatement Across All Sectors to Reduce Emissions to Half 2005 Levels by 2050
World Energy-Related CO2 Emissions Abatement by Region Most Abatement is Outside of OECD Countries ~40% China and India
Average Annual Electricity Capacity Additions To 2050 Needed to Achieve the BLUE Map Scenario Well Underway with Nuclear, On-Shore Wind, and Hydro, Massive Increases Needed in All Other Modes
Nuclear Reactors Are Being Constructed At Roughly the IEA Blue Required Rate www.euronuclear.org/info/encyclopedia/n/nuclear-power-plant-world-wide.htm IEA Blue Requires 30GW Added Per Year
Must Greatly Accelerate Installation of Off-Shore Wind and Solar Electricity Generation Each of These Projects Has Been Underwayfor a Decade with Intense Public Controversy Need to Install ~20 “Anza Borrego”Arrays (30,000 Dishes, 0.75 GW) Per Year of Concentrated Solar Power: ~14 GW Total Every Year Till 2050 Need to Install ~30 “Cape Wind’s” (170 Turbines, 0.5 GW) Per Year Off-Shore Wind Farms: ~15GW Total Every Year Till 2050
IEA Blue Requires Rapid Transformation of Light Duty Vehicle Sales Plug-In Hybrid, All-Electric & Fuel-Cell Vehicles Dominate Sales After 2030 OECD Transport Emissions are ~60% Less Than in 2007, But Those in Non-OECD Countries are ~60% Higher by 2050
Transition to Low Carbon Infrastructure:Race for Low-Carbon Industries is New Driver Previous Goal—By 2020, 20% Cut Below 1990 Levels "If we stick to a 20 per cent cut, Europe is likely to lose the race to compete in the low-carbon world to countries such as China, Japan or the US - all of which are looking to create a more attractive environment for low-carbon investment,“ --British, French, and German Climate and Environmental Ministers Source: Sydney Morning News
Top Corporate Leaders Call for Innovation Funding:A Business Plan for America’s Energy Future • Our Recommendations (June 2010) • Create an Independent National Energy Strategy Board • Invest $16 Billion per Year in Clean Energy Innovation • Create Centers of Excellence with Strong Domain Expertise • Fund ARPA-e at $1 Billion Per Year • Establish and Fund a New Energy Challenge Program to Build Large-scale Pilot Projects www.americanenergyinnovation.org
Visionary Low Carbon Infrastructure Plan: Zero Carbon Australia Decarbonizing Electricity Generation in Ten Years http://beyondzeroemissions.org/ Wind & Concentrating Solar Thermal (CST) Are Major Renewable Energy Sources
ICT is a Critical Element in Achieving Countries Greenhouse Gas Emission Reduction Targets • GeSI member companies: • Bell Canada, • British Telecomm., • Plc, • Cisco Systems, • Deutsche Telekom AG, • Ericsson, • France Telecom, • Hewlett-Packard, • Intel, • Microsoft, • Nokia, • Nokia Siemens Networks, • Sun Microsystems, • T-Mobile, • Telefónica S.A., • Telenor, • Verizon, • Vodafone Plc. • Additional support: • Dell, LG. www.smart2020.org
The Transformation to a Smart Energy Infrastructure:Enabling the Transition to a Low Carbon Economy Applications of ICT could enable emissions reductions of 15% of business-as-usual emissions. But it must keep its own growing footprint in check and overcome a number of hurdles if it expects to deliver on this potential. www.smart2020.org
Reduction of ICT Emissions is a Global Challenge –U.S. and Canada are Small Sources U.S. plus Canada Percentage Falls From 25% to 14% of Global ICT Emissions by 2020 www.smart2020.org
The Global ICT Carbon Footprint by Subsector The Number of PCs (Desktops and Laptops) Globally is Expected to Increase from 592 Million in 2002 to More Than Four Billion in 2020 PCs Are Biggest Problem Telecoms Infrastructure & Devices 2nd Largest Data Centers Are Rapidly Improving www.smart2020.org
Somniloquy: Increasing Laptop Energy Efficiency http://mesl.ucsd.edu/yuvraj/research/documents/Somniloquy-NSDI09-Yuvraj-Agarwal.pdf Yuvraj Agarwal, et al., UCSD & Microsoft Laptop Network interface Peripheral Low power domain Secondary processor Network interface Management software Main processor, RAM, etc Somniloquy Allows PCsin “Suspend to RAM” to Maintain Their Network and Application Level Presence
Carbon Pricing Will Have Major Impact on Data Centers—A New Driver for Energy Efficiency
The GreenLight Project: Instrumenting the Energy Cost of Computational Science • Focus on 5 Communities with At-Scale Computing Needs: • Metagenomics • Ocean Observing • Microscopy • Bioinformatics • Digital Media • Measure, Monitor, & Web Publish Real-Time Sensor Outputs • Via Service-oriented Architectures • Allow Researchers Anywhere To Study Computing Energy Cost • Enable Scientists To Explore Tactics For Maximizing Work/Watt • Develop Middleware that Automates Optimal Choice of Compute/RAM Power Strategies for Desired Greenness • Partnering With Minority-Serving Institutions Cyberinfrastructure Empowerment Coalition Source: Tom DeFanti, Calit2; GreenLight PI
New Techniques for Dynamic Power and Thermal Management to Reduce Energy Requirements • NSF Project Greenlight • Green Cyberinfrastructure in Energy-Efficient Modular Facilities • Closed-Loop Power &Thermal Management • Dynamic Power Management (DPM) • Optimal DPM for a Class of Workloads • Machine Learning to Adapt • Select Among Specialized Policies • Use Sensors and Performance Counters to Monitor • Multitasking/Within Task Adaptation of Voltage and Frequency • Measured Energy Savings of Up to 70% per Device • Dynamic Thermal Management (DTM) • Workload Scheduling: • Machine learning for Dynamic Adaptation to get Best Temporal and Spatial Profiles with Closed-Loop Sensing • Proactive Thermal Management • Reduces Thermal Hot Spots by Average 60% with No Performance Overhead System Energy Efficiency Lab (seelab.ucsd.edu) Prof. Tajana Šimunić Rosing, CSE, UCSD CNS
UCSD is Installing Zero Carbon EmissionSolar and Fuel Cell DC Electricity Generators UCSD 2.8 Megawatt Fuel Cell Power Plant Uses Methane Available Late 2009 San Diego’s Point Loma Wastewater Treatment Plant Produces Waste Methane 2 Megawatts of Solar Power Cells Being Installed
GreenLight Experiment:Direct 400v DC-Powered Modular Data Center UCSD DC Fuel Cell 2800kW Sun MDC <100-200kW All With DC Power Supplies Next Step: Couple to Solar and Fuel Cell • Concept—avoid DC To AC To DC Conversion Losses • Computers Use DC Power Internally • Solar & Fuel Cells Produce DC • Can Computers & Storage Use DC Directly? • Is DC System Scalable? • How to Handle Renewable Intermittency? • Prototype Being Built in GreenLight Instrument • Build DC Rack Inside of GreenLight Modular Data Center • 5 Nehalem Sun Servers • 5 Nehalem Intel Servers • 1 Sun Thumper Storage Server • Building Custom DC Sensor System to Provide DC Monitoring • Operational August-Sept. 2010 Source: Tom DeFanti, Greg Hidley, Calit2; Tajana Rosing, UCSD CSE
Challenge: How Can Commercial Modular Data Centers Be Made More Energy Efficient? Source: Michael Manos
UCSD Scalable Energy Efficient Datacenter (SEED): Energy-Efficient Hybrid Electrical-Optical Networking • Build a Balanced System to Reduce Energy Consumption • Dynamic Energy Management • Use Optics for 90% of Total Data Which is Carried in 10% of the Flows • SEED Testbed in Calit2 Machine Room and Sunlight Optical Switch • Hybrid Approach Can Realize 3x Cost Reduction; 6x Reduction in Cabling; and 9x Reduction in Power PIs of NSF MRI: George Papen, Shaya Fainman, Amin Vahdat; UCSD
Calit2 Photonics Systems Laboratory Is Investigating Novel Telecoms Energy Efficiency UCSD Photonics ECE Testbed Faculty Stojan Radic Optical communication networks; all-optical processing; parametric processes in high-confinement fiber and semiconductor devices. George Papen Advanced photonic systems including optical communication systems, optical networking, and environmental and atmospheric remote sensing. Joseph Ford Optoelectronic subsystems integration (MEMS, diffractive optics, VLSI); Fiber optic and free-space communications. Shaya Fainman Nanoscale science and technology; ultrafast photonics and signal processing Shayan Mookherjea Optical devices and optical communication networks, including photonics, lightwave systems and nano-scale optics. • Networking “Living Lab” Testbed Core • Real-Time Terabit/s Processing • Single 640Gbps Channel Transport Over >100km • Sub-Watt Transport of Terabit Channel
Terabit Channel: Data Center, LAN/Metro:How to Minimize Terabit Dissipation Sub-Watt Transport of Terabit Channel * Tbps TX Tbps RX • Maintain Channel Integrity in Optical Domain: • No Forward Error Correction (FEC) • No Regeneration • No Digital Signal Processing (DSP) Source: Nikola Alic, Stojan Radic, Calit2, UCSD
Sub-Watt Transport of Terabit Channel:1000x Reduction in Transport Dissipation Back-to-Back Pico-Joule per Bit Efficiency 1 ps 1 ps 1 ps Transmission 100 km without Conjugation Transmission 100 km with Conjugation Legacy Standard Single Mode Fiber (SMF-28) Source: Nikola Alic, Stojan Radic, Calit2, UCSD
Calit2@UCSD’s Wireless Power Amplifier Lab:Making Wireless Telecom Infrastructure More Efficient Oct. 2005 Calit2 Sets World Record 50% Efficiency for High-Power Amplifiers for Cellular Base Stations Power Transistor Tradeoffs Si-LDMOS, GaN, & GaAs Price & Performance Power Amplifier Tradeoffs WiMAX & 3.9GPP LTE Efficiency & Linearity STMicroelectronics Digital Signal Processing Tradeoffs Pre-Distortion, Memory Effects & Power Control MIPS & Memory IEEE Topical Symposium on Power Amplifiers for Wireless Communications was held Sept. 14-15, 2009
Applying ICT – The Smart 2020 Opportunityfor 15% Reduction in GHG Emissions Smart Transportation Smart Buildings Smart Electrical Grid Smart Motors www.smart2020.org
Application of ICT Can Lead to a 5-Fold GreaterDecrease in GHGs Than its Own Carbon Footprint While the sector plans to significantly step up the energy efficiency of its products and services, ICT’s largest influence will be by enabling energy efficiencies in other sectors, an opportunity that could deliver carbon savings five times larger than the total emissions from the entire ICT sector in 2020. --Smart 2020 Report Major Opportunities for the United States* • Smart Electrical Grids • Smart Transportation Systems • Smart Buildings • Virtual Meetings * Smart 2020 United States Report Addendum www.smart2020.org
The Transition to a Low Carbon Society Requires Rethinking Our Cities Infrastructure www.unep.org/publications/ebooks/kick-the-habit/pdfs/KickTheHabit_en_lr.pdf
Over 670 College and University President’s Have Signed the Climate Commitment Pledge Can Universities Live 5-10 Years Ahead of Cities -- Helping Accelerate the Climate Adaptation of Global Society? “We recognize the need to reduce the global emission of greenhouse gases by 80% by mid-century. Within two years of signing this document, we will develop an institutional action plan for becoming climate neutral.” www.presidentsclimatecommitment.org
Making University Campuses Living Laboratories for the Greener Future www.educause.edu/EDUCAUSE+Review/EDUCAUSEReviewMagazineVolume44/CampusesasLivingLaboratoriesfo/185217
UCSD as a Model Green Campus • Second-Largest User Of Electricity (~40 MW) In San Diego • 45,000 Daily Occupants • After the City Itself, the Seventh-Largest City in the U.S. • Aggressive Program to De-Carbonize Generating Electricity • Natural Gas Co-Gen Facility Supplies ~90% of Campus Electricity • Saves ~$8 Million Annually in Energy Costs • Installed 1.2 MW Of Solar Panels (With an Additional 2 MW Likely) • Acquiring a 2.8 MW Fuel Cell in 2011 • Powered by Methane from San Diego Waste-Treatment Plant • UCSD Campus Fleet 45% Renewables • 300 Small Electric Cars • 50 Hybrids • 20 Full-Size Electrics by 2011 www.educause.edu/EDUCAUSE+Review/EDUCAUSEReviewMagazineVolume44/CampusesasLivingLaboratoriesfo/185217
UC Irvine as a Model Green Campus • California’s “Flex Your Power” Statewide Energy-Efficiency Campaign Only University Campus Cited in “Best Overall” • UCI Led in Efficiency-Saving 3.7 Million KWh of Electricity During 07–08 • Reducing Peak Demand by up to 68% • Saving Nearly 4 Million Gallons Of Water Annually. • UCI’s 2008 GHG Reduction Program Annually Eliminates 62,000 MtCO2e • Saves the Campus ~$30 Million • SunEdison Financed, Built, & Operates Solar Energy System • In March 2009, UCI Began Purchasing Energy Generated by System • Will Produce >24 GWh over 20 Years • 18 MW Combined Heating, Power, & Cooling Co-Gen Plant • Employs 62,000 Ton-Hour Chilled-Water Thermal Energy Storage System • Capable of Reducing up to 6 MW of Electrical Peak Demand • UCI 1st US Campus to Retrofit Shuttles for Pure Biodiesel • Research Program with Toyota Plug-In Prius in Nov 2007 www.educause.edu/EDUCAUSE+Review/EDUCAUSEReviewMagazineVolume44/CampusesasLivingLaboratoriesfo/185217
Real-Time Monitoring of Building Energy Usage:Toward a Smart Energy Campus
Using the Campus as a Testbed for Smart Energy:Making Buildings More Energy Efficient Calit2 and CSE are Very Energy Intensive Buildings kW/sqFt Year Since 1/1/09
Smart Energy Buildings:Active Power Management of Computers • 500 Occupants, 750 Computers • Instrumentation to Measure Macro and Micro-Scale Power Use • 39 Sensor Pods, 156 Radios, 70 Circuits • Subsystems: Air Conditioning & Lighting • Conclusions: • Peak Load is Twice Base Load • 70% of Base Load is PCs and Servers Source: Yuvraj Agarwal, Thomas Weng, Rajesh Gupta, UCSD
Contributors to Base Load UCSD Computer Science & Engineering Building Computers Mechanical Lighting Source: Yuvraj Agarwal, Thomas Weng, Rajesh Gupta, UCSD • IT Loads Account for 50% (Peak) to 80% (Off-Peak)! • Includes Machine Room + Plug Loads (PCs and Laptops) • IT Equipment, Even When Idle, Not Put to Sleep • Duty-Cycling IT Loads Essential To Reduce Baseline http://energy.ucsd.edu
Reducing Energy Requirements of Networked PCs: UCSD’s Enterprise “Sleep Server” System http://energy.ucsd.edu/device/meterdisplay.php?meterID=3091420330&mode=pastyear Estimated Energy Savings With Sleep Server: 46.64% Source: Yuvraj Agarwal, Thomas Weng, Rajesh Gupta, UCSD
Reducing CO2 From Travel:Linking the Calit2 Auditoriums at UCSD and UCI September 8, 2009 Sept. 8, 2009 Photo by Erik Jepsen, UC San Diego
High Definition Video Connected OptIPortals:Virtual Working Spaces for Data Intensive Research NASA Interest in Supporting Virtual Institutes LifeSize HD NASA Ames Lunar Science Institute Mountain View, CA Source: Falko Kuester, Kai Doerr Calit2; Michael Sims, NASA
Symposia on Green ICT:Greening ICT and Applying ICT to Green Infrastructures www.calit2.net/newsroom/article.php?id=1498 Webcasts Available at: www.calit2.net/newsroom/article.php?id=1456 Calit2@UCSD