Optimizing Skylight Geometry for Coral Reef Studies: Practical Applications of Radiance
This workshop presentation explores recent practical applications of Radiance in optimizing skylight geometry for the California Academy of Sciences’ Coral Reef Studies. Key methods for maximizing direct sunlight on coral reefs while minimizing solar heat gain are discussed. Two distinct modeling methods are analyzed, highlighting a successful ray tracing technique to evaluate solar exposure over time. Additionally, insights into code compliance analysis for residential developments, such as the Battersea Power Station project in London, are presented, showcasing effective daylighting strategies.

Optimizing Skylight Geometry for Coral Reef Studies: Practical Applications of Radiance
E N D
Presentation Transcript
Recent Practical Applications Using Radiance • 2003 Radiance Workshop • Matt Franks, Arup Lighting • Andrew McNeil, Arup Lighting
Overview • California Academy of Science – San Francisco, CA • Skylight geometry opimization • Historical weather data • Battersea Power Station Residential Development – London, UK • Code compliance analysis • “Modular” modeling process • Acoustical Reflector Analysis • Using Radiance for geometrical studies of reflector coverage
The California Academy of Sciences Coral Reef Studies
Project Overview • Rain Forest • Planetarium
N Project Overview • Coral Reef
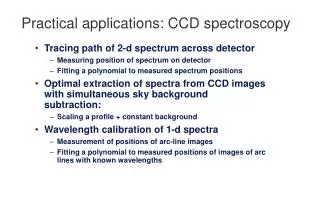
Objectives • Objectives • Maximize direct sun on the coral reef. • Minimize solar heat gain (reduce skylight glazing) • Tasks • Identify where skylights should be located to maximize direct solar radiation. • Quantify hours of direct solar radiation on the coral reef.
Determining “Effective” Skylight Placement. • Method #1 – Assign luminance values to sky based on probability of sun. FAILED • Method #2 – Trace rays in direction of sun for a Yes/No response. SUCCESS
Method #1 • Step 1 Luminance values were assigned to the sky based on the number of hours the sky was in each segment (we used 360 x 180 segements).
Method #1 Sky • Step 2 • A grid was defined on the roof. • A point in the center of the coral reef was designated as the origin point. Grid Roof Reef
Method #1 Sky • Step 3 • A direction is calculated for each grid point using the point and the reef “origin.” • That direction is used to test the sky. A value equal to the number of hours the sun spends in that portion of the sky is returned. Grid Roof Reef
Method #1 • Result Amount of sun (in hours) that from a given point on the roof that lands on the coral reef “origin” per year.
Method #1 Method #1 failed because: • It only accounted for sun landing on one point of the coral reef. • The generated sky seemed to be skewed towards the solstices. These problems might have been overcome, but a better method came to us.
Method #2 Sky • Step 1 Assign a glow material to the surface of the coral reef. • Step 2 Trace a ray from the roof grid downwards in the direction of the the sun for every hour of the year. Grid Roof Reef
Method #2 • Result The entire reef is considered instead of just one point. Amount of sun (in hours) that from a given point on the roof that lands on the coral reef per year.
Initial Skylight Configuration • Original skylight configuration (shaded areas are skylights).
Initial Skylight Configuration • Hours of direct sun on coral reef per year (during a completely sunny year).
Revised Skylight Configuration • Revised skylight configuration (shaded areas are skylights).
Revised Skylight Configuration • Hours of direct sun on coral reef per year (during a completely sunny year).
Revised Skylight Configuration • Solar Gain Reduced by more than 70% (considering skylights associated with coral reef) • Hours of direct sunlight reduced by only 33%
Incorporating Weather Data • What good is data from a “completely sunny year?” • It provides a basis for comparison • Dosen’t help to understand actual performance. • SAMSON Data (has solar and sky radiation data) • Hourly data integrates well with hourly analysis!
Incorporating Weather Data • Hours of direct sun on coral reef during 1990.
Incorporating Weather Data • Average hours of direct sun on coral reef by month during 1990.
Pictures • Perspective image of grid & roof.
Pictures • Daylight factor on planetarium dome.
Pictures • Rendering of coral reef area from piazza.
Pictures • Rendering through rainforest (translucent dome).
Pictures • Rendering of building entrance.
Battersea Power Station Residental Development • Three apartment blocks as part of a larger redevelopment • London, UK • British Standard - BS 8206-2 • Lighting For Buildings – Part 2: Code of Practice for Daylighting • Goal: Determine compliance with the standard
Model Detail • Early study • Very simplified model • Assumptions for materials • Not included: • Façade screen • Surrounding buildings
Goals • Determine compliance with British Standard for Daylighting • Step 1 – Determine “worst case” apartments • Step 2 – Calculate daylight factor in “worst case” apartments • Step 3 – Produce “Compliance Contours” • Step 4 – Determine percentage possible sunlight in “worst case” apartments
50% 40% 30% 20% 10% 10% Step 1 – Determine “Worst Case” Apartments • Daylight factor distribution on each façade • Overcast sky model
Step 2 – Calculate D. F. in “Worst Case” Apartments • Model built as simple blocks (no interior) • Use mkillum to “capture” daylight distribution landing on façade
Apartment B Apartment A Step 2 – Calculate D. F. in “Worst Case” Apartments • Apply mkillum distribution to individual apartment model • 1 model – many possible distributions • Hand edited mkillum output
1 2 1 2 3 3 Step 2 – Calculate D. F. in “Worst Case” Apartments Apartment A Apartment B
Step 3 – Produce “Compliance Contours” • Determine relationship between daylight factor on façade and daylight factor in apartment • Bedroom: 1% minimum average d.f. • Living Room: 1.5% minimum average d.f.
Apartment B Apartment A Step 4 – Percentage possible sunlight • Calculated for balcony area only • Simplified model using monthly probabilities • Minimum 25% possible hours
Apartment B Apartment A 337(21%) 312(20%) 277(18%) 229(15%) 189(12%) 0(0%) Step 4 – Percentage possible sunlight
Acoustical Reflector Analysis • Problem • Need method to show patterns of acoustical reflector coverage in a 3D model • Apparently no available acoustical software to do this • Why use Radiance? • Easy to model complex spaces • Acoustical reflections similar to light reflections • Ability to change image generating parameters • Material properties • Exposure • Combining images
Early development of process • First try – not very successful • Acoustical source modeled as light source • Acoustical reflectors modeled as mirrors (colored) • Single model, single rendering • Visibility of reflected patches was a problem • Second try – split renderings and combine later • More control over exposure • More post-processing options • More flexible
Acoustical source – small “light” sphere Acoustical reflector – colored “mirror” with substituted plastic Floor, walls, ceiling – plastic Simple test room
Red Reflector Image • Right reflector as red mirror • Left reflector as grey plastic • Viewpoint just in front of source
Blue Reflector Image • Right reflector as grey plastic • Left reflector as blue mirror • Viewpoint just in front of source
Diffuse Image • Right reflector as red plastic • Left reflector as blue plastic • Viewpoint just in front of source • Same light source
Subtract Ambient Light • Leaves only reflected patches
Add Patches to Diffuse Image • Visualization of reflector coverage in 3D space
Next Steps • More complex model • More reflectors • More colors • Limitations • Reflectors should be smooth, not faceted • Limited number of colors • More colors makes a more complicated process for adding/subtracting images