Download
1 / 20
200 likes | 355 Vues
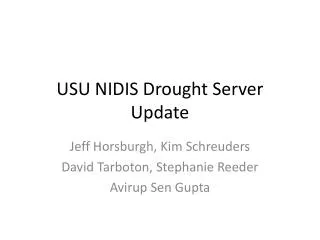
USU NIDIS Drought Server Update. Jeff Horsburgh, Kim Schreuders David Tarboton, Stephanie Reeder Avirup Sen Gupta. Goals. Enhance access to drought related data Enable custom drought index evaluation. CUAHSI HydroServer – Data Publication. Lake Powell Inflow and Storage.

E N D
USU NIDIS Drought Server Update Jeff Horsburgh, Kim Schreuders David Tarboton, Stephanie Reeder Avirup Sen Gupta
Goals • Enhance access to drought related data • Enable custom drought index evaluation CUAHSI HydroServer – Data Publication Lake Powell Inflow and Storage CUAHSI HydroDesktop – Data Access and Analysis
Overall System Architecture NWIS WOF SNOTEL WOF USBR Reservoir WOF NCDC Precip WOF SNODAS WOF • HydroDesktop • Displays “published” drought index values • Calculates and displays “personal” index values Harvest Utility Get Data and Aggregate to Monthly and Half Monthly WOF Aggregated Data Values ODM GIS Framework Time Series Analyst Hosted Map Services Calculate Data Distributions Calculate Drought Index Values Map Application (ArcGIS Server) ESRI Base Map Services
Set of query functions ReturnsdatainWaterML WaterML and WaterOneFlow WaterML is an XML language for communicating water data WaterOneFlow is a set of web services based on WaterML Zaslavsky et al., 2007, OGC 07-041r1, http://portal.opengeospatial.org/files/?artifact_id=21743 .
CUAHSI Web Services Established for Primary Data Sources • USGS NWIS – daily streamflow • http://river.sdsc.edu/wateroneflow/NWIS/DailyValues.asmx • USDA NRCS SNOTEL – 6 standard variables including SWE • http://drought.usu.edu/SNOTEL/cuahsi_1_1.asmx • NCDC Precipitation – precipitation data only • http://drought.usu.edu/NCDC/cuahsi_1_1.asmx • USBR Reservoirs – storage, elevation, inflow, outflow • http://drought.usu.edu/USBRReservoirs/cuahsi_1_1.asmx • SNODAS HUC8,10,12 – snow water equivalent • http://drought.usu.edu/SNODAS_HUC8/cuahsi_1_1.asmx • http://drought.usu.edu/SNODAS_HUC10/cuahsi_1_1.asmx • http://drought.usu.edu/SNODAS_HUC12/cuahsi_1_1.asmx The foundation of the system: multiple data sources with common interfaces and a common data transmission language (WaterML)
WaterOneFlow Web Services For Agency Data2 Different Modes Mode 1: Pass Through (NWIS, SNOTEL, USBR) Mode 2: Store and Serve (NCDC, SNODAS) Agency Website or Web Service Providing Data Metadata Harvester Metadata and Data Harvester GetValues GetSites Catalog GetSiteInfo Catalog + Data GetVariables GetVariableInfo WaterML WaterOneFlow Web Service WaterOneFlow Web Service
Value added data • Level 1 – original agency data collected at points (USGS gages, SNOTEL Sites, etc.) • Level 2 – time aggregated Level 1 data, monthly and half monthly • Level 3 – spatial aggregation of Level 2 data for each drought index input variable at HUC10 level • Level 4 – drought index values calculated for HUC10s based on Level 3 values
Ongoing Web Service Work • Reservoirs – working with CBRFC to get access to all of the reservoir data that they have, not just USBR reservoirs (this would be a new service) • SNODAS – we have loaded everything they have given us, but need to figure out how to update
Time Aggregated Level 2 Data • Level 1 data harvested from the WaterOneFlow web services • Level 1 data are aggregated based on data type • e.g., sum, ending value • Monthly • Half monthly • Published using a WaterOneFlow web service Provide the time aggregated data that serve as inputs for calculating Level 3 data for each spatial unit for which drought indices can be calculated.
Spatially Aggregated Level 3 DataDrought Index Input Variables for Spatial Units • USGS 10 Digit Hydrologic Units (~300 in Upper Colorado) • Provide an estimate for each drought index variable for each HUC10 unit – streamflow, reservoir storage, precipitation, snow water equivalent • Publish the Level 3 data for each 10 digit HUC using a WaterOneFlow web service .
Spatial Interpolations • Streamflow - Gage subwatershed approach • Runoff estimated for gage subwatersheds (adjusted for reservoir storage changes) • Area weighted average runoff calculated for each HUC10 based on area of gage subwatersheds in each HUC10 • Subwatershedstreamflow(local contribution) and watershed streamflow (everything upstream) • Precipitation • Delaunay triangle interpolation • Reservoir Storage • Snow Water Equivalent • Delaunay triangle interpolation of SNOTEL Sites with elevation correction? • Use SNODAS data
Calculating available flow for HUC watersheds Q2 Q1 Q2 S1 Measured flow and storage S1 B Q1 RA=Q1/AA RB=(Q2- Q1-S1)/AB Gage subwatershed unit runoff A RH1=RB RH2=(a2ARA +a2BRB)/(a2A +a2B) RH3=RB H3 HUC 10 unit runoff H1 a3 a1 QH1=RH1a1 QH2=RH2a2 (a2=a2A+a2B) QH3 =RH3a3+QH1+QH2 HUC 10 available streamflow (everything upstream) a2B a2A H2
Level 4 – Calculated Drought Index Values • Use Level 3 data in drought index equations to calculate index values for 10 digit HUCs • Publish drought index values as a web service • Display visually in the map application • Display 10 digit HUCs colored by drought index values
HydroServer Websitehttp://drought.usu.edu/hydroserverwebsite/
Map Application and Time Series Analysthttp://drought.usu.edu/nidismap/
http://hydroserver.codeplex.com http://hydrodesktop.codeplex.com This is an open system, with open source development. Contributors and development partners are welcome
Conclusions • Framework for a standards based sharing of drought information established • Desktop based customization possible • Need to incorporate additional drought information content • Need to transition to sustainable agency based services