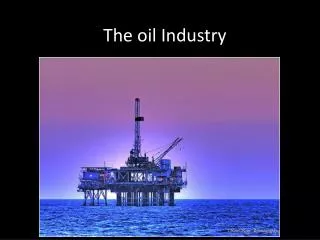
Oil Industry Future Challenges
Oil Industry Future Challenges . by Shri. B.K. Bakhshi. Oil - Price Peaks & Effect on Indian Economy. CRUDE OIL PRICES (Indian Basket). Peak – July 08 - $142/BBL. VERTICAL INTEGRATION HELPS OIL MAJORS.

Oil Industry Future Challenges
E N D
Presentation Transcript
Oil Industry Future Challenges by Shri. B.K. Bakhshi
CRUDE OIL PRICES(Indian Basket) • Peak – July 08 - $142/BBL
VERTICAL INTEGRATION HELPS OIL MAJORS • Integrated International Majors profits go down when crude price go down and profits go up when crude price are up. Examples: • The slump in crude prices to less than $15 per bbl in 1998 led to mergers – such as Exxon Mobil, Philips Conoco, etc. • When crude prices rose from $33 per bbl in April 2004 to 70.25 per bbl in Aug 2005 – 2 weeks after Katrina Hurricane. Gasoline prices in USA peaked to $3.06 per USG. The combined net income of Exxon Mobil, BP, Royal Dutch, Shell & Conoco Philips totaled $ 32.8 Billion during the quarter ending Sept 2005 on a revenue of $ 378 Billion. * Source Black Gold by George Orwell, page 147
Journey so far Government’s liberalization drive hastened the pace of hydrocarbon market development in India. *1955 figure @1950-60 Avg#As on 1.4.07 $1990-200 Avg ^Product pipeline
Sectoral Overview – Upstream Upstream sector in India is a relatively unexplored market with reserves estimated in only 15 of the 26 sedimentary basins. Key Facts • 26 sedimentary basins: 3.14 mn sq kM (44% onland and 56% offshore) • Prognosticated Hydrocarbon reserves: 28 BTOE (<25% established) ~ 200 bn barrels • Crude oil production - 34 MMT • Upstream NOCs dominate production/acreage • Directorate General of Hydrocarbons (DGH) vested with upstream regulatory functions • New Exploration Licensing Policy (NELP)
Exploration Acreage – April ’96 Exploration Acreage – April ‘07 Sectoral Overview – Upstream NELP rounds have opened up large sedimentary areas for exploration to private and JV companies leading to decrease in unexplored or poorly explored areas from 67 to less than 37%Out of total 205 bn bbl of prognosticated resources in 15 basins, 66 bn bbls have been established since 1947. 15 bn bbl in-place reserves were added during last 7 years Sedimentary Area Source: Directorate General of Hydrocarbon
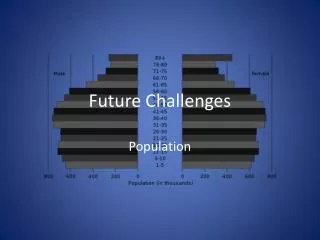
Expected Share of Natural Gas in the Energy Basket in India (Hydrocarbon Vision 2025)
Sectoral Overview – Downstream India’s downstream sector is dominated by NOCs. Major Downstream Players as on April 1, 2008 Key Facts Refining capacity (MMTPA) • 19 refineries with 149 MMTPA installed capacity • 105% capacity utilization in 2007-08 • Refined product consumption – 129 MMT • Refined product consumption: 7% annual growth • Refined product net exports – 39 MMT, Gross exports $26.8 bn 07-08 (50% growth over 2006-07) • Product pipelines stretch over 9,500 km • New entrants in the oil marketing business include RIL, Shell, EOL, MRPL and NRL • Domestic auto sales 14.1% CAGR (’06-07 over ’01-02); petroleum products consumption jumped by 7% from last year • Over 34,000 retail outlets Source: MoPNG Market Share of sale of Petroleum Products (in Vol sales excl. CNG & LNG) Source: Monthly IPR
Sectoral Overview – Downstream Refining industry in India is poised for rapid growth with additional investments planned over the next decade supported by GoI’s intention to promote India as an integrated refining and petrochemical export hub. Developments Refining Capacity Vs. Crude Import in MMT as on April 1 • 241 MMTPA refining capacity by 2012 • 38 MMTPA addition in the Pvt sector • Private investments from Chevron/Mittal • RIL/Essar/IOC venturing abroad (Kuwait, Africa, Turkey etc.) • Crude import and product exports expected to jump Investments • Investment of over $22 bn estimated for creating new refining capacity • Refinery upgradation projects to require investments of the order of $2.5 bn Source: XI FYP, MoPNG
Oil Companies Under Recoveries 2007-08 – On price controlled products
SHARE OF OIL REVENUE IN TOTAL REVENUE IN 2002-05 *Centre’s revenue is taken as net of transfers to States. States’ revenue is the total receipts of own tax and non-tax revenue.Source: Report of the Standing Committee on Petroleum & Natural Gas in Parliament, Government of India; State Finances, A study of Budget of 2004-05, RBI, Government of India; Budget documents, Government of India.
Renewable Energy Sources Potential * Table 7.3.3/7.3.16 10th plan document
Biofuels Activities JV under formation with Chhattisgarh Government to produce 30,000 MTPA Biodiesel 2000 ha revenue wasteland allotted by Government of M.P. In Jhabua district for energy crop plantation. Investment approval being obtained 10% ethanol blends in MS by 2012 (The end of the 11th plan) Discussions with U.P. and Rajasthan Government for creating Biodiesel units.
Status - Hydrogen Activities of IOC • IOC R&D had set up the India’s first Hydrogen Dispensing Station in October, 2005 which is being used for fueling test vehicles. • A similar Hydrogen-CNG Dispensing Station is being set up at Delhi in Dwarka by IndianOil which will be commissioned by end of 2008. • IOC R&D working closely with SIAM members under an MNRE project for optimisation of various vehicles to Hydrogen-CNG. • IOC R&D planning further projects related to Hydrogen production, development of codes & standards etc.
Perspective Plan Long Term Plan Vision Annual Plan 5 Year Plan Planning Cycle – Key Corporate Activity
Knowledge Doubling • itself every 5-7 years • The importance of • R&D escalating • exponentially Rate of Change of Everything is Hyperbolic Knowledge Explosion Years
Formula for Organisational Perpetuity • Creativity – Without which no new Technologies products goods & services can emerge. • Continuity – Without which in a changing environment the sense of purpose and/or directions may get lost and develop aberrations. 3. Discontinuity – The essence of discontinuity / change is to discard the irrelevant / obsolete on a continuous basis. Without it no forward progress can take place.