Download
1 / 19
190 likes | 429 Vues
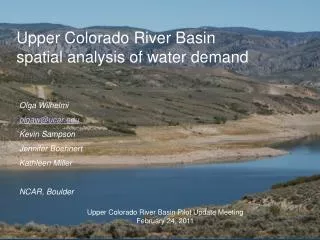
Upper Colorado River Basin spatial analysis of water demand. Olga Wilhelmi olgaw@ucar.edu Kevin Sampson Jennifer Boehnert Kathleen Miller NCAR, Boulder. Upper Colorado River Basin Pilot Update Meeting February 24, 2011. Project goals .

E N D
Upper Colorado River Basinspatial analysis of water demand Olga Wilhelmi olgaw@ucar.edu Kevin Sampson Jennifer Boehnert Kathleen Miller NCAR, Boulder Upper Colorado River Basin Pilot Update Meeting February 24, 2011
Project goals • Provide information that is useful for managing current drought risks and for adapting to changing climate in the UCRB. • Objectives: • Assess knowledge gaps in the UCRB water demand data • Analyze spatial and temporal patterns in water demand • Examine topological relationships among water users and their respective sources • Link spatial (and non-spatial) information on water demand to water supply for drought early warning
Water demand estimation • Lack of standard definitions and consistent methodologies for water demand estimation • Academic and operational purposes • Categories • Surveys of empirical data • Agroclimatological modeling • Modeling of future water demand based on population growth • Diverse scales of data aggregations / different temporal records • National • USGS: regional and national water use trends (5-year intervals) • BOR: annual consumptive uses and loses • State • Colorado Water Conservation Board and Department of Water Resources collect and model data on water use (Colorado Decision Support System (CDSS) • HydroBase (historic, real-time, call chronology) • Tools: StateCU, StateMod • Local • Water providers • The Upper Colorado River Basin Study (Hydrospehre, 2003)
Local scale water demand • Secondary markets of water (transfers, exchanges, rent) • Colorado HydroBase • Water diversion water use? • Decreed water right = primary use? • Incomplete “call chronology”
Spatial patterns of water demand • GIS System for Analysis / Visualization • Geodatabase Component • Spatial / Non-spatial tables archived together • Map Document (GIS) Component • Analysis and display and manipulation of spatial / non-spatial data • Toolboxes • Models built explicitly for performing geoprocessing operations on the database • Flexibility to work across scales • scales for water administration vs scales for drought planning and response
Conceptual design and data availability Surface water (streams and reservoirs) Groundwater Main Source Water Right Seniority Secondary Sources Water Provider Administration No. Assoc. Structure Structure Lease/Trade/Buy Water Augmentation Quota Increase X, Y Location Stream Mile Delivery Resources to Lease / Buy Growth (future demand) User X,Y Location Other users Upstream/ Downstream Competition (Seasonality of demand) Local Weather/Drought Conditions X, Y Structure Location Water right seniority Data Available Data unavailable
NIDIS water demand data model • Data Model is used to design the schema of a database: tables, columns, relationships Provides a template for water demand projects and for NIDIS geodatabase Allows to exchange data in a similar format
NHD Plus Geodatabase HydroBase U.S. Drought Monitor
Tools • NIDIS Analysis tools • Linking diversion records to irrigated parcels • Linking users to each other on the river network • Demand summaries by geography or sector (use type) • Developing drought “early warning” tools (linking supply and demand) • Tools executed in ArcGIS Desktop • Flexibility of input datasets (test on Yampa Basin)
Demand estimation • Use of historical diversion table (StructureAnnualAmt) to derive average historical monthly diversions to a subset of structures • Baseline for ‘demand’ • Can be analyzed sector by sector • Spatial and temporal components of demand
Demand estimation (cont.) • Hydrobase ‘StructureAnnualAmt’ table gives historical diversions from each structure on a monthly basis. • Units in AF • Values for Summit, Grand, and Eagle Counties.
Net volume of water rights for Grand County, by primary decreed use.
Interview w/ division engineer • Alan Martellaro - Div. 5 Engineer & Judy Sappington, River Administrator • October 21, 2010 • Basin vulnerabilities • Relation to “A-B Line” • Demand measures • Standardizing irrigation deliveries by parcel size • Suggestion of case study areas (i.e., Troublesome creek)
River Administration • Unique methods for • Division 5 administration • Zones that determine • subjectivity of senior calls • “A-B Line” (red) • Separates main stem calls from local calls • Drawn/redrawn based on frequency of calls from particular users
Irrigated Agriculture • Irrigated parcel layer in CDSS GIS Layers • > 50,000 acres irrigated land in study area • Each parcel associated with a diversion structure • Diversions yield parcel ‘wetness’ (acre feet per acre) Irrigated Parcels on Troublesome Creek
Supply/demand analysis tools are in development • Drought impacts “early warning” analysis • Linking users to sources of supply • potential input factors • Administration area, A-B line • Seniority in water rights system • Relative seniority • Supply measure?
Summary and next steps • The NIDIS water demand data model was designed to provide a quantitative spatial analysis framework for geometrically connecting the water users to the network of water delivery systems within the context of a basin or other administrative unit. • The combination of the spatial and non-spatial elements in a geodatabase allows analysis of water demand and potential drought impacts . • Next steps: • Documentation and testing of scalability of the assessment tools and methods for the entire Upper Colorado River Basin. • Linking the water demand analysis with the current tools for monitoring water supply in the Upper Colorado River Basin