Download
1 / 8
80 likes | 220 Vues
Brain magnetic resonance imaging with contrast dependent on blood oxygenation. Ogawa et al. PNAS (1990) 87 :9868. Introduction. Blood oxygenation level dependent (BOLD) contrast recently discovered Two previous Ogawa et al. papers, also 1990

E N D
Brain magnetic resonance imaging with contrast dependent on blood oxygenation Ogawa et al. PNAS (1990) 87:9868
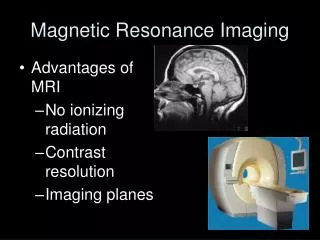
Introduction • Blood oxygenation level dependent (BOLD) contrast recently discovered • Two previous Ogawa et al. papers, also 1990 • Deoxyhemoglobin decreases proton signal in gradient-echo MRI • Its paramagnetic effect is “felt” beyond the blood vessel • Note the difference between BOLD contrast and BOLD signal: • BOLD contrast ∝ 1 / [O2] • BOLD signal ∝[O2]
Effect of CO2 (a) 100% O2 (b) 90% O2 / 10% CO2 CO2 increased blood flow from 0.4 to 1.7 cm/sec, reducing contrast despite decreased inspired O2.
Effect of insulin & hypoglycemia (a) blood glucose > 20 mg /dl (b) blood glucose < 20 mg / dl (c) rescue after injecting mannose Flow increased from 0.4-0.6 to 0.7-1.1 cm/sec. Reduced metabolism likely contributes to contrast changes.
Effect of anaesthesia (a) 0.75% halothane (b) 3% halothane (c) 100% N2 Blood flow decreased from 0.25 (a) to 0.12 cm/sec (b). Contrast changes mostly due to reduced O2 metabolism.
Simulation of BOLD contrast (a) Simulated contrast (b) Signal intensity profile (anoxic brain) BOLD contrast changes within physiological ranges of venous [O2]
Conclusions • BOLD contrast depends on supply and demand • Contrast changes in the presence and absence of blood flow changes • Estimated detectable change inblood oxygenation = 20% • BOLD MRI predicted to complement PET • Deoxyhemoglobin is an intrinsic contrast agent • Good time resolution
Questions • What was the n? • Are these effects reliable across animals? • Why is contrast greater in 2a vs. 3c? • How does presaturation recovery work? • Is BOLD contrast really not observed in spin-echo imaging? (See introduction) • What vessel sizes contribute most to the BOLD effect in humans? (Ogawa et al. ’93) • Which is most important, blood flow or O2 metabolism? (Kim et al. ’97)