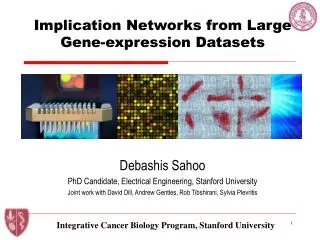
Implication Networks from Large Gene-expression Datasets
Debashis Sahoo PhD Candidate, Electrical Engineering, Stanford University Joint work with David Dill, Andrew Gentles, Rob Tibshirani, Sylvia Plevritis. Implication Networks from Large Gene-expression Datasets. Integrative Cancer Biology Program, Stanford University. Motivation.

Implication Networks from Large Gene-expression Datasets
E N D
Presentation Transcript
Debashis Sahoo PhD Candidate, Electrical Engineering, Stanford University Joint work with David Dill, Andrew Gentles, Rob Tibshirani, Sylvia Plevritis Implication Networks from Large Gene-expression Datasets Integrative Cancer Biology Program, Stanford University ICBP, Stanford University
Motivation • Current approaches • Clustering • Co-expression • Linear regression • Mutual information CCNB2 BUB1B ICBP, Stanford University
Hidden Relationships • Pearson’s correlation = -0.1 • GABRB1 and ACPP are not linearly related. • There is a Boolean relationship • ACPP high GABRB1 low • GABRB1 high ACPP low GABRB1 ACPP ICBP, Stanford University
Outline • Motivation • Boolean analysis • Boolean implication network • Biological insights • Conserved Boolean network • Conclusion ICBP, Stanford University
Outline • Motivation • Boolean analysis • Boolean implication network • Biological insights • Conserved Boolean network • Conclusion ICBP, Stanford University
Boolean Analysis Workflow Get data GEO [Edgar et al. 02] Normalize RMA [Irizarry et al. 03] Determine thresholds Discover Boolean relationships Biological interpretation ICBP, Stanford University
Intermediate Threshold Determine threshold • A threshold is determined for each gene. • The arrays are sorted by gene expression • StepMiner is used to determine the threshold High CDH expression Low Sorted arrays [Sahoo et al. 07] ICBP, Stanford University
Discovering Boolean Relationships • Analyze pairs of genes. • Analyze the four different quadrants. • Identify sparse quadrants. • Record the Boolean relationships. • ACPP high GABRB1 low • GABRB1 high ACPP low 2 4 GABRB1 1 3 ACPP ICBP, Stanford University
Boolean Relationships • There are six possible Boolean relationships • A low B low • A low B high • A high B low • A high B high • Equivalent • Opposite ICBP, Stanford University
Four Asymmetric Boolean Relationships • A low B low • A low B high • A high B low • A high B high PTPRC low CD19 low XIST high RPS4Y1 low RPS4Y1 CD19 PTPRC XIST FAM60A low NUAK1 high COL3A1 high SPARC high SPARC NUAK1 FAM60A COL3A1 ICBP, Stanford University
Two Symmetric Boolean Relationships Opposite Equivalent CCNB2 EED BUB1B XTP7 ICBP, Stanford University
Outline • Motivation • Boolean analysis • Boolean implication network • Biological insights • Conserved Boolean network • Conclusion ICBP, Stanford University
Boolean Implication Network • Boolean implications form a directed graph • Nodes: • For each gene A • A high • A low • Edges: • A high to B low • A high B low A high B low C high ICBP, Stanford University
Size of The Boolean Networks highhigh highlow lowlow lowhigh Equivalent Opposite ICBP, Stanford University
Boolean Networks Are Not Scale Free Human Total Symmetric Asymmetric #probesets #probesets #probesets #relationships #relationships #relationships ICBP, Stanford University
Outline • Motivation • Boolean analysis • Boolean implication network • Biological insights • Conserved Boolean network • Conclusion ICBP, Stanford University
Gender Specific • XIST • X inactivation specific transcript • Expressed in female • RPS4Y1 • Y-linked gene • Expressed in male only • Boolean relationship • XIST highRPS4Y1 low RPS4Y1 XIST [Day et al. 07] ICBP, Stanford University
Tissue Specific • ACPP • Acid phosphatase, prostate • Prostate specific gene • GABRB1 • GABA A receptor, beta 1 • Brain specific • Boolean relationship • ACPP highGABRB1 low GABRB1 ACPP ICBP, Stanford University
Development • HOXD3 • Homeobox D3 • Fruit fly antennapedia homolog • HOXA13 • Homeobox A13 • Fruit fly ultrabithorax homolog • Boolean relationship • HOXD3 high HOXA13 low HOXA13 HOXD3 [Rinn et al. 07] ICBP, Stanford University
Differentiation • PTPRC • protein tyrosine phosphatase, receptor type, C • B220 • Expressed in B cell precursors and mature B cell • CD19 • Expressed in mature B cell • Boolean relationship • PTPRC low CD19 low CD19 PTPRC ICBP, Stanford University
Biological Insights Gender Tissue GABRB1 RPS4Y1 XIST ACPP Development Differentiation HOXA13 CD19 HOXD3 PTPRC ICBP, Stanford University
Outline • Motivation • Boolean analysis • Boolean implication network • Biological insights • Conserved Boolean network • Conclusion ICBP, Stanford University
Fly 17M 208M Human 336M Mouse Conserved Boolean Networks • Find orthologs between human, mouse and fly using EUGene database. • Search for orthologous gene pairs that have the same Boolean relationship. [Gilbert, 02] 41K 4M ICBP, Stanford University
Conserved Boolean Relationships Mouse Human Fly • Two largest connected components in the network of equivalent genes • 178 genes: highly enriched for cell-cycle and DNA replication • 32 genes: highly enriched for synaptic functions CycB Ccnb2 CCNB2 Bub1 Bub1b BUB1B ICBP, Stanford University
Conserved Asymmetric Boolean Relationships GABRB1 expressing cells have low cell cycle (BUB1B) activity. Mouse Human Fly Lcch3 Gabrb1 GABRB1 Bub1 Bub1b BUB1B ICBP, Stanford University
Outline • Motivation • Boolean analysis • Boolean implication network • Biological insights • Conserved Boolean network • Conclusion ICBP, Stanford University
Conclusion • Boolean analysis • Boolean relationships are directly visible on the scatter plot. • Enables discovery of asymmetric relationship. • Can reveal known biological processes. • Has potential for new biological discovery. • Boolean network • Is large • Is not scale free ICBP, Stanford University
Acknowledgements • Leonore A Herzenberg • James Brooks • Joe Lipsick • Gavin Sherlock • Howard Chang • Stuart Kim • The Felsher Lab: • Natalie Wu • Cathy Shachaf • Dean Felsher Funding: ICBP Program (NIH grant: 5U56CA112973-02) ICBP, Stanford University
The END ICBP, Stanford University
Example ICBP, Stanford University
Determine threshold Its hard to determine a threshold for this gene. StepMiner usually puts a threshold in the middle for this case. ICBP, Stanford University
(expected – observed) statistic = √ expected a00 ( ) a01 a11 a00 1 error rate = + 2 (a00+ a01) (a00+ a10) a00 a10 Statistical Tests • Compute the expected number of points under the independence model • Compute maximum likelihood estimate of the error rate ICBP, Stanford University