Download
1 / 24
240 likes | 377 Vues
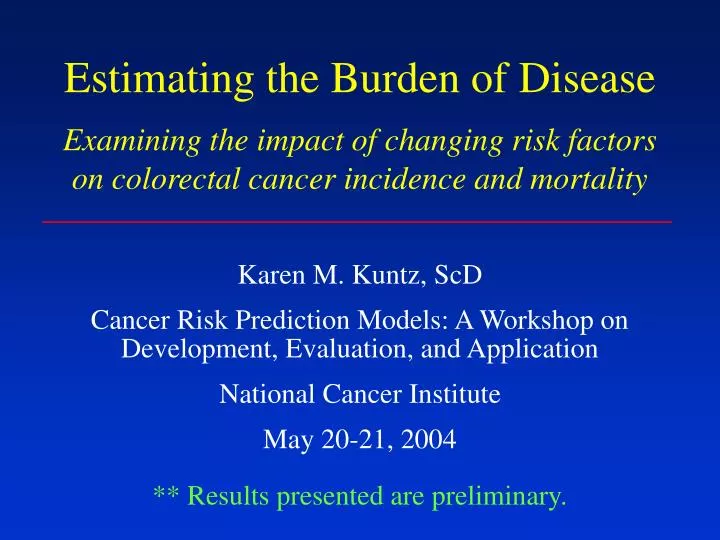
Estimating the Burden of Disease Examining the impact of changing risk factors on colorectal cancer incidence and mortality. Karen M. Kuntz, ScD Cancer Risk Prediction Models: A Workshop on Development, Evaluation, and Application National Cancer Institute May 20-21, 2004.

E N D
Estimating the Burden of DiseaseExamining the impact of changing risk factors on colorectal cancer incidence and mortality Karen M. Kuntz, ScD Cancer Risk Prediction Models: A Workshop on Development, Evaluation, and Application National Cancer Institute May 20-21, 2004 ** Results presented are preliminary.
Decision-Analytic Models • Analytical structures that represent key elements of a disease • Goal: evaluate policies in terms of costs and health benefits (not estimation) • Cohort models vs. population-based model • Risk functions often incorporated
120 100 80 CRC Events per 100,000 60 40 20 0 1975 1980 1985 1990 1995 2000 Year Age-standardized incidence and mortality Cases Deaths
CRC Risk Factors • Body mass index (BMI) • Smoking • Folate intake (multivitamin use) • Physical activity • Red meat consumption • Fruit and vegetable consumption • Aspirin use • Hormone replacement therapy (HRT)
Individual Risk Functions • Pr(CRC | BMI, smoking, MV use, etc.) • Annual risk • 10-year probability • Estimate from cohort studies • Nurses’ Health Study (NHS) • Health Professionals’ Follow-up Study (HPFS)
NHS & HPFS Data • Multivariate logistic regression of NHS/HPFS data provide information about the relationship between risk factors and diagnosed (but not underlying) CRC Aggregate CRC risk function Diagnosis free Detected CRC
Stage-Specific Risk Functions • Goal: decompose the aggregate function into stage-specific risk functions Aggregate CRC risk function Disease free Adenoma Undetected CRC Risk function2 f(age, activity, etc.) Risk function1 f(age, aspirin use, etc.) Detected CRC
Our Approach • Establish “observed relationship” between risk factor and diagnosed CRC • Simulate incidence of CRC in hypothetical cohort that is matched to study cohort • Use regression analysis to examine simulated relationship between risk factor and diagnosed CRC • Calibrate ORs of simulated data analysis to those of cohort analysis
Example: 50 yo white woman BMI = 25 kg/m2 Non-smoker MV user 5 met-hr/wk 2 sv/wk red meat 5 sv/dy fruit/veg No aspirin use No HRT use Lifetime CRC risk: 4.8%
Example: 50 yo white woman • BMI = 35 kg/m2 • Smoker • No MV use 5 met-hr/wk 2 sv/wk red meat 5 sv/dy fruit/veg No aspirin use No HRT use Lifetime CRC risk: 9.7%
CISNET Model Risk factor trends CRC Model CRC incidence & mortality Screening behavior Diffusion of new treatments Calendar Time 1970 1975 1980 1985 1990
120 100 80 CRC Cases per 100,000 60 40 20 0 1975 1980 1985 1990 1995 2000 2005 Year Age-standardized incidence US Population
120 100 80 CRC Cases per 100,000 60 40 20 0 1975 1980 1985 1990 1995 2000 2005 Year Age-standardized incidence US population Model population
120 100 80 CRC Cases per 100,000 60 40 20 0 1975 1980 1985 1990 1995 2000 2005 Year Age-standardized incidence Flat trends since 1970 85 74 Risk factor trends
120 100 80 CRC Cases per 100,000 60 40 20 0 1975 1980 1985 1990 1995 2000 2005 Year Age-standardized incidence 74 71 Healthy weight in 1970
120 100 80 CRC Cases per 100,000 60 40 20 0 1975 1980 1985 1990 1995 2000 2005 Year Age-standardized incidence 74 63 No smoking in 1970
120 100 80 CRC Cases per 100,000 60 40 20 0 1975 1980 1985 1990 1995 2000 2005 Year Age-standardized incidence 74 56 All MV users in 1970
200 180 160 140 120 CRC Cases per 100,000 100 80 60 40 20 0 1975 1980 1985 1990 1995 2000 2005 Year Age-standardized incidence 185 Worst case 74 Best case 27
60 50 40 CRC Deaths per 100,000 30 20 10 0 1975 1980 1985 1990 1995 2000 2005 Year Age-standardized mortality US Population
60 50 40 CRC Deaths per 100,000 30 20 10 0 1975 1980 1985 1990 1995 2000 2005 Year Age-standardized mortality US population Model population
60 50 40 CRC Deaths per 100,000 30 20 10 0 1975 1980 1985 1990 1995 2000 2005 Year Age-standardized mortality Flat trends since 1970 39 34 Risk factor trends
80 60 CRC Deaths per 100,000 40 20 0 1975 1980 1985 1990 1995 2000 2005 Year Age-standardized mortality 79 Worst case 34 Best case 14
Concluding Remarks • Trends in risk factors over the past 35 years account for a 13% decrease in both CRC incidence and mortality compared to “flat trends” • Population-based simulation models provide an important tool for evaluating the impact of changing risk factors