Download
1 / 80
800 likes | 953 Vues
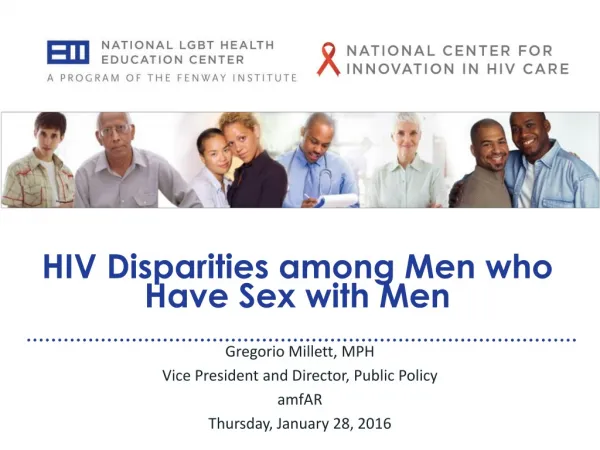
HIV Disparities among Men who Have Sex with Men. Gregorio Millett, MPH Vice President and Director, Public Policy amfAR Thursday, January 28, 2016. Continuing Medical Education Disclosure. Program Faculty : Gregorio Millett, MPH

E N D
HIV Disparities among Men who Have Sex with Men Gregorio Millett, MPH Vice President and Director, Public Policy amfAR Thursday, January 28, 2016
Continuing Medical Education Disclosure • Program Faculty: Gregorio Millett, MPH • Current Position: Vice President and Director, Public Policy, amfAR • Disclosure: No relevant financial relationships. Presentation does not include discussion of off-label products. It is the policy of The National LGBT Health Education Center, Fenway Health that all CME planning committee/faculty/authors/editors/staff disclose relationships with commercial entities upon nomination/invitation of participation. Disclosure documents are reviewed for potential conflicts of interest and, if identified, they are resolved prior to confirmation of participation. Only participants who have no conflict of interest or who agree to an identified resolution process prior to their participation were involved in this CME activity. This Live series activity, 2015-2016 LGBT Health Education Training Series, from 07/15/2015 - 07/14/2016, has been reviewed and is acceptable for credit by the American Academy of Family Physicians. Physicians should claim only the credit commensurate with the extent of their participation in the activity.
Learning Objectives • Understand the latest trends in racial/ethnic, age, and geographic disparities affecting MSM along the HIV continuum. • Understand the multiple structural factors beyond individual risk behaviors that increase vulnerability among MSM of color and in the South. • Learn ways ASOs, CBOs, and health centers can increase Black and Latino MSMs’ ability to access PrEP and other prevention interventions and reduce disparities in HIV treatment.
HIV Diagnoses Among Persons Aged 13 Years or Older by Transmission Category and Year of Diagnosis Source: A. Johnson et al. JAMA 312:432, 2014
Annual Number of HIV Diagnoses among MSM, United States, 2002 and 2011 Source: A. Johnson et al. JAMA 312:432, 2014
Lifetime Risk of HIV Diagnosis by Race • Whites • 1 in 104 for men • 1 in 588 for women • Hispanics • 1 in 35 for men • 1 in 114 for women • Blacks • 1 in 16 for men • 1 in 30 for women Hall et al. JAIDS. 2008; 49: 294-297
Lifetime Risk of HIV Diagnosis by Race • Whites • 1 in 104 for men • 1 in 6 MSM • 1 in 588 for women • Hispanics • 1 in 35 for men • 1 in 5 MSM • 1 in 114 for women • Blacks • 1 in 16 for men • 1 in 3 MSM • 1 in 30 for women Hall et al. JAIDS. 2008; 49: 294-297
HIV Disparities among Black MSM vs. White MSM, Black Community, and U.S. Population 3X (Millett et. al, The Lancet, 2012; Slide courtesy G Millett) (Millett et. al, The Lancet, 2012; Slide courtesy G Millett)
HIV Disparities among Black MSM vs. White MSM, Black Community, and U.S. Population 22X 3X (Millett et. al, The Lancet, 2012; Slide courtesy G Millett) (Millett et. al, The Lancet, 2012; Slide courtesy G Millett)
HIV Disparities among Black MSM vs. White MSM, Black Community, and U.S. Population 72X 22X 3X (Millett et. al, The Lancet, 2012; Slide courtesy G Millett) (Millett et. al, The Lancet, 2012; Slide courtesy G Millett)
HIV Diagnoses among MSM age 13-24 by Race/Ethnicity 2005-2014
The HIV Care Continuum in the United States Biggest drop-offs in the care continuum result from inadequate supports to link, retain, re-engage, and support people to remain engaged in care — functions the health system historically has not been good at performing. ART = antiretroviral therapy. Source: Adapted from CDC “HIV Care Saves Lives—Viral Suppression in Key,” November 2014.
Large Disparities in Success of HIV Care Continuums in High Income Counties A. Raymond et al. J Int AIDS Soc. 17(4 Suppl 3):19507, 2014; CDC/MMWR, 11/25/2014
Disparities persist between black and other MSM throughout treatment cascade (24 comparative studies) Disparities Persist Between Black and other MSM Throughout Treatment Cascade Undiagnosed HIV OR, 6.38 (4.33-9.39) HIV Detection Diagnosed HIV+ OR, 3.00 (2.06-4.40) ART utilization/ access OR, 0.56 (0.41-0.76) >200 CD4 cells/mm3 before ART initiation OR, 0.40 (0.26-0.62) Healthcare visits OR, 0.61 (0.42-0.90) ART adherence OR, 0.50 (0.33-0.76) HIV suppression OR, 0.51 (0.31-0.83) Viral Suppression (Millett, 2012)
Disparities persist between black and other MSM throughout treatment cascade (24 comparative studies) Disparities Persist Between Black and other MSM Throughout Treatment Cascade Lower income (<$20k) OR, 3.42 (1.94-6.01) Undiagnosed HIV OR, 6.38 (4.33-9.39) HIV Detection Diagnosed HIV+ OR, 3.00 (2.06-4.40) ART utilization/ access OR, 0.56 (0.41-0.76) >200 CD4 cells/mm3 before ART initiation OR, 0.40 (0.26-0.62) Healthcare visits OR, 0.61 (0.42-0.90) ART adherence OR, 0.50 (0.33-0.76) HIV suppression OR, 0.51 (0.31-0.83) Viral Suppression (Millett, 2012)
Disparities persist between black and other MSM throughout treatment cascade (24 comparative studies) Disparities Persist Between Black and other MSM Throughout Treatment Cascade Lower income (<$20k) OR, 3.42 (1.94-6.01) Undiagnosed HIV OR, 6.38 (4.33-9.39) HIV Detection Diagnosed HIV+ OR, 3.00 (2.06-4.40) ART utilization/ access OR, 0.56 (0.41-0.76) >200 CD4 cells/mm3 before ART initiation OR, 0.40 (0.26-0.62) Health insurance OR, 0.47 (0.29-0.77) Healthcare visits OR, 0.61 (0.42-0.90) ART adherence OR, 0.50 (0.33-0.76) HIV suppression OR, 0.51 (0.31-0.83) Viral Suppression (Millett, 2012)
Disparities by Structural Factors Across Treatment Cascade No insurance Low income ART Adherence Housing status Low social support No insurance Low income Housing status No insurance Low income Housing status Non-hospital care initiation No insurance Low income <3 medical visits Food insecurity (Sources: Muthulingam, 2013; Hannah, 2013; CDC, 2012; Hall, 2012; Traeger, 2012; Torian, 2011; Knowlton, 2010; Meade, 2009; Mugavero, 2009; Weiser, 2009; Kidder, 2007; Bell, 1999)
Disparities by Structural Factors Across Treatment Cascade No insurance Low income ART Adherence Housing status Low social support No insurance Low income Housing status No insurance Low income Housing status Non-hospital care initiation No insurance Low income <3 medical visits Food insecurity (Sources: Muthulingam, 2013; Hannah, 2013; CDC, 2012; Hall, 2012; Traeger, 2012; Torian, 2011; Knowlton, 2010; Meade, 2009; Mugavero, 2009; Weiser, 2009; Kidder, 2007; Bell, 1999)
HIV-Related Summary Odds Ratios of Evaluated Outcomes by Rank (Structural variables) (Millett, The Lancet, 2012)
Immigrant Latinos & HIV Outcomes • US-Mexico border: 46% Latinos dx late vs. 37% Whites (Espinoza, 2009) • higher proportion of late diagnoses among foreign-born compared to US-born Latinos (51% vs. 39%) • increased risk of delayed diagnosis among foreign-born vs. US-born males (AOR 1.7, 95% CI 1.4–2.2) • LA County Spanish-speaking Latinos 3x more likely to present late compared to English-speaking Latinos (Wohl, 2009) • Greater mortality rates among Latinos born in Puerto Rico than mainland US (Hanna, 2008; Nash, 2005)
Status of State Medicaid Expansion Decisions – March 2015 ME VT WA NH MT ND MN OR MA NY WI SD ID MI* RI CT WY PA NJ IA NE OH DE IN IL NV MD CO UT WV VA CA DC KS MO KY NC TN AZ SC OK AR NM GA AL 39% PLWHA live in states not expanding MS AK LA TX FL HI Implementing Expansion (29 States including DC) – 60% PLWHA Debating Expansion (6 States) – 14% PLWHA Not Moving Forward at this Time (16 States) – 25% PLWHA NOTES: As of March 2015; PLWHA estimates based on those living with an HIV diagnosis, does not add to 100% due to rounding SOURCES: KFF analysis of data from CDC. KFF, State health facts, http://kff.org/health-reform/state-indicator/state-activity-around-expanding-medicaid-under-the-affordable-care-act/; Centers for Disease Control and Prevention, HIV Surveillance Report, Vol. 25; published February 2015.
Current Status of State Medicaid Expansion Decisions Current Status of State Medicaid Expansion Decisions ME VT WA NH* MT* ND MN OR MA NY WI* SD ID MI* RI CT WY PA* NJ IA* NE OH DE IN* IL NV MD CO UT WV VA CA DC KS MO KY NC TN AZ SC OK AR* NM GA AL MS LA* TX AK FL HI Adopted (32 States including DC) Adoption Under Discussion (3 States) Not Adopting At This Time (16 States) NOTES: Current status for each state is based on KCMU tracking and analysis of state executive activity. *AR, IA, IN, MI, MT, NH and PA have approved Section 1115 waivers. Coverage under the PA waiver went into effect 1/1/15, but it has transitioned coverage to a state plan amendment. Coverage under the MT waiver went into effect 1/1/2016. LA’s Governor Edwards signed an Executive Order to adopt the Medicaid expansion on 1/12/2016, but coverage under the expansion is not yet in effect. WI covers adults up to 100% FPL in Medicaid, but did not adopt the ACA expansion. See source for more information on the states listed as “adoption under discussion.” SOURCE: “Status of State Action on the Medicaid Expansion Decision,” KFF State Health Facts, updated January 12, 2016. http://kff.org/health-reform/state-indicator/state-activity-around-expanding-medicaid-under-the-affordable-care-act/
Percent of estimated diagnoses of AIDS by region and year a Diagnoses of AIDS were adjusted for reporting delay, but not for incomplete reporting b Regions consist of Northeast (Connecticut, Maine, Massachusetts, New Hampshire, New Jersey, New York, Pennsylvania, Rhode Island, and Vermont), Midwest (Illinois, Indiana, Iowa, Kansas, Michigan, Minnesota, Missouri, Nebraska, North Dakota, Ohio, South Dakota, and Wisconsin), South (Alabama, Arkansas, Delaware, Florida, Georgia, Kentucky, Louisiana, Maryland, Mississippi, North Carolina, Oklahoma, South Carolina, Tennessee, Texas, Virginia, and West Virginia), and West (Alaska, Arizona, California, Colorado, Hawaii, Idaho, Montana, Nevada, New Mexico, Oregon, Utah, Washington, and Wyoming) (Slide courtesy Joseph Prejean)
HIV Case-Fatality Rate Greatest in the South (Hanna, 2011)
Disproportionate Impact of HIV among MSM of Color in the Southern US All MSM: 1 in 4 to 1 in 14 White MSM: 1 in 7 to 1 in 25 Latino MSM: 1 in 6 to 1 in 19 Black MSM: 1 in 2 to 1 in 5 (Leib, 2011)
PrEP: A Revolutionary Innovation,but Execution may not be Easy
Observational study following 657 people, 99% MSM Men average, MSM took PrEP for average of 7 Condom use decreased and STIs increased over 2.5 years, but no HIV infections Trial enrolling 545 participants at 13 sexual health clinics in England. Reduced risk of HIV infection by 86% over 1 year MSM at-risk for HIV Take PrEP– and it reduces their chances of infection
Observational study following 657 people, 99% MSM Men average, MSM took PrEP for average of 7 Condom use decreased and STIs increased over 2.5 years, but no HIV infections Trial enrolling 545 participants at 13 sexual health clinics in England. Reduced risk of HIV infection by 86% over 1 year MSM at-risk for HIV Take PrEP– and it reduces their chances of infection • Adherence is low among youth • Difficult to engage youth in continuous care • Access to PrEP while on parent’s insurance
Heard of PrEP & PrEP prescribing experience (Bay Area Provider Survey) 91% 78% 70% 26%
Heard of PrEP & PrEP prescribing experience (Bay Area Provider Survey) 91% 78% 70% 26%
Heard of PrEP & PrEP prescribing experience (Bay Area Provider Survey) 91% 78% 70% 26%
Heard of PrEP & PrEP prescribing experience (Bay Area Provider Survey) 91% 78% 70% 26%
PrEP Acceptance among Black MSM • Online survey of Black MSM recruited from 4 Deep South States • 71% reported at least 1 instance of unprotected sex in past 6 months
PrEP Acceptance among Black MSM • Online survey of Black MSM recruited from 4 Deep South States • 71% reported at least 1 instance of unprotected sex in past 6 months
Gaps in Care Among HIV-negative Black MSM, experiencing stigma from health care providers was associated with longer gaps in time since last HIV care appointment
Black Clinicians and HIV Testing (Jordan, 2013) (Jordan, 2013)
Impact of Stressful Events on Antiretroviral Medication Adherence