Download
1 / 87
870 likes | 892 Vues
Discover the Earth's climate evolution, future outlook, and the impacts of human activities on the environment. Explore factors influencing temperature, beneficial/harmful effects, and strategies to combat climate change.

E N D
Overview Questions • How have the earth’s temperature and climate changed in the past? • How might the earth’s temperature change in the future? • What factors influence the earth’s average temperature? • What are some possible beneficial and harmful effects of a warmer earth?
Overview Questions (cont’d) • How can we slow projected increases in the earth’s temperature or adapt to such changes? • How have human activities depleted ozone in the stratosphere, and why should we care?
The topic of climate change is like a puzzle with many different pieces—oceans, the atmosphere, ecosystems, polar ice, natural and human influences. Scientists have been working on this puzzle for more than a century, and while there are still gaps in our knowledge, most experts feel we have the puzzle is complete enough to show that human activities are having an adverse effect on our planet. We will look at many of those puzzle pieces, the evidence behind them, and the conclusions we can draw from them.
Core Case Study: Studying a Volcano to Understand Climate Change • NASA scientist correctly predicted that the 1991 Philippines explosion would cool the average temperature of the earth by 0.5Co over a 15 month period and then return to normal by 1995. Figure 20-1
Core Case Study: Studying a Volcano to Understand Climate Change • The NASA model was correct. • The success convince scientists and policy makers that climate model projections should be taken seriously. • Other climate models have shown that global temperatures are likely to rise several degrees during this century.
Scientists have a good understanding of what has changed earth’s climate in the past: • Incoming solar radiation is the main climate driver. Its energy output increased about 0.1% from 1750 to 1950, increasing temperatures by 0.2°F (0.1°C) in the first part of the 20th century. But since 1979, when we began taking measurements from space, the data show no long-term change in total solar energy, even though Earth has been warming. • Repetitive cycles in Earth’s orbit that occur over tens of thousands of years can influence the angle and timing of sunlight. • In the distant past, drifting continents make a big difference in climate over millions of years by changing ice caps at the poles and by altering ocean currents, which transport heat and cold throughout the ocean depths. • Huge volcanic eruptions can cool Earth by injecting ash and tiny particles into the stratosphere. • Changes in the concentration of greenhouse gases, which occur both naturally and as a result of human activities, also influence Earth’s climate
PAST CLIMATE AND THE GREENHOUSE EFFECT • Over the past 900,000 years, the troposphere has experienced prolonged periods of global cooling and global warming. • For the past 1,000 years, temperatures have remained fairly stable but began to rise during the last century.
PAST CLIMATE AND THE GREENHOUSE EFFECT Figure 20-2
Average temperature over past 900,000 years Average surface temperature (°C) Thousands of years ago Fig. 20-2a, p. 465
Average temperature over past 130 years Average surface temperature (°C) Year Fig. 20-2b, p. 465
Temperature change over past 22,000 years Agriculture established Temperature change (C°) End of last ice age Average temperature over past 10,000 years = 15°C (59°F) Years ago Fig. 20-2c, p. 465
Temperature change over past 1,000 years Temperature change (C°) Year Fig. 20-2d, p. 465
How Do We Know What Temperatures Were in the Past? • Scientists analyze tiny air bubbles trapped in ice cores learn about past: • troposphere composition. • temperature trends. • greenhouse gas concentrations. • solar,snowfall, and forest fire activity. Figure 20-3
How Do We Know What Temperatures Were in the Past? • In 2005, an ice core showed that CO2 levels in the troposphere are the highest they have been in 650,000 years. Figure 20-4
Concentration of carbon dioxide in the atmosphere (ppm) Carbon dioxide Variation of temperature (C°) from current level Temperature change End of last ice age Thousands of years before present Fig. 20-4, p. 466
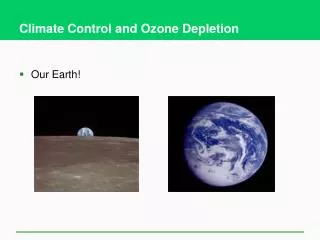
The Natural Greenhouse Effect • Three major factors shape the earth’s climate: • The sun. • Greenhouse effect that warms the earth’s lower troposphere and surface because of the presence of greenhouse gases. • Oceans store CO2 and heat, evaporate and receive water, move stored heat to other parts of the world. • Natural cooling process through water vapor in the troposphere (heat rises).
Major Greenhouse Gases • The major greenhouse gases in the lower atmosphere are water vapor, carbon dioxide, methane, and nitrous oxide. • These gases have always been present in the earth’s troposphere in varying concentrations. • Fluctuations in these gases, plus changes in solar output are the major factors causing the changes in tropospheric temperature over the past 400,000 years.
“Greenhouse effect” Increasing greenhouse gases trap more heat
Major Greenhouse Gases • Increases in average concentrations of three greenhouse gases in the troposphere between 1860 and 2004, mostly due to fossil fuel burning, deforestation, and agriculture. Figure 20-5
CO2 comes from a variety of sources. For example, plants take up carbon dioxide in the air to make wood, stems, and leaves, and then release it back into the air when the leaves fall or the plants die. The concern today is that fossil fuel use is putting huge amounts of CO2 in the atmosphere at a rate faster than the climate system can adapt to.
Earth is getting warmer by virtually every measure we know, and the temperature has been well above normal for more than 25 years. Although increases of 1.0-1.6°F (0.6-0.9°C) over the last century or so may not sound very threatening, remember that’s a global average. The warming is stronger over land than over oceans and in the higher latitudes than in the tropics.
CLIMATE CHANGE AND HUMAN ACTIVITIES • Evidence that the earth’s troposphere is warming, mostly because of human actions: • The 20th century was the hottest century in the past 1000 years. • Since 1900, the earth’s average tropospheric temperature has risen 0.6 C°. • Over the past 50 years, Arctic temperatures have risen almost twice as fast as those in the rest of the world. • Glaciers and floating sea ice are melting and shrinking at increasing rates.
CLIMATE CHANGE AND HUMAN ACTIVITIES • Warmer temperatures in Alaska, Russia, and the Arctic are melting permafrost releasing more CO2 and CH4 into the troposphere. • During the last century, the world’s sea level rose by 10-20 cm, mostly due to runoff from melting and land-based ice and the expansion of ocean water as temperatures rise.
The Scientific Consensus about Future Climate Change • There is strong evidence that human activities will play an important role in changing the earth’s climate during this century. • Coupled General Circulation Models (CGCMs) couple, or combine, the effects of the atmosphere and the oceans on climate.
CGCM of the Earth’s Climate • Simplified model of major processes that interact to determine the average temperature and greenhouse gas content of the troposphere. Figure 20-6
Sun Troposphere Cooling from increase Green- house gases Heat and CO2 emissions Aerosols CO2 removal by plants and soil organisms CO2 emissions from land clearing, fires, and decay Heat and CO2 removal Warming from decrease Ice and snow cover Shallow ocean Land and soil biotoa Long-term storage Natural and human emissions Deep ocean Fig. 20-6, p. 469
Sun CO2 removal by plants and soil organisms Greenhouse gases Cooling from increase Heat and CO2 removal CO2 emissions from land cleaning, fires, and decay Warming from decrease Aerosols Heat and CO2 emissions Long-term storage Troposphere Ice and snow cover Shallow ocean Land and soil biotoa Natural and human emissions Deep ocean Stepped Art Fig. 20-6, p. 469
The Scientific Consensus about Future Climate Change • Measured and projected changes in the average temperature of the atmosphere. Figure 20-7
How Would You Vote? • Do you believe that we will experience significant global warming during this century? • a. No. Claims for significant global warming during this century are based on unreliable climate models. • b. Yes. Even with the uncertainties, the models still indicate significant global warming during this century.
Why Should We Be Concerned about a Warmer Earth? • A rapid increase in the temperature of the troposphere during this century would give us little time to deal with its harmful effects. • As a prevention strategy scientists urge to cut global CO2 emissions in half over the next 50 years. • This could prevent changes in the earth’s climate system that would last for tens of thousands of years.
FACTORS AFFECTING THE EARTH’S TEMPERATURE • Some factors can amplify (positive feedback) and some can dampen (negative feedback) projected global warming. • There is uncertainty about how much CO2 and heat the oceans can remove from the troposphere and how long the heat and CO2 might remain there. • Warmer temperatures create more clouds that could warm or cool the troposphere.
Effects of Higher CO2 Levels on Photosynthesis • Increased CO2 in the troposphere can increase plant photosynthesis (PS) but: • The increase in PS would slow as the plants reach maturity. • Carbon stored by the plants would be returned to the atmosphere as CO2 when the plants die. • Increased PS decreases the amount of carbon stored in the soil. • Tree growth may temporarily slow CO2 emissions in the S. Hemisphere but is likely to increase CO2 emissions in the N. Hemisphere.
FACTORS AFFECTING THE EARTH’S TEMPERATURE • Aerosol and soot pollutants produced by human activities can warm or cool the atmosphere, but such effects will decrease with any decline in outdoor air pollution. • Warmer air can release methane gas stored in bogs, wetlands, and tundra soils and accelerate global warming.
EFFECTS OF GLOBAL WARMING • A warmer climate would have beneficial and harmful effects but poor nations in the tropics would suffer the most. • Some of the world’s floating ice and land-based glaciers are slowly melting and are helping warm the troposphere by reflecting less sunlight back into space.
EFFECTS OF GLOBAL WARMING • Between 1979 and 2005, average Arctic sea ice dropped 20% (as shown in blue hues above). Figure 20-8
Russia * North pole Greenland Alaska (U.S.) Canada Fig. 20-8, p. 474
Rising Sea Levels • During this century rising seas levels are projected to flood low-lying urban areas, coastal estuaries, wetlands, coral reefs, and barrier islands and beaches. Figure 20-10
Sea-level rise projections : a few inches to a few feet • 2 ft: U.S. would lose 10,000 square miles • 3 ft: Would inundate Miami • Affects erosion, loss of wetlands, freshwater supplies • Half of the world’s population lives along coasts • Big question: Ice sheets The oceans will continue their rise in the coming century. The IPCC’s best estimates range from a few inches to a few feet by 2100. If the rise is 2 feet, the US could lose 10,000 square miles, If they rise three, they will inundate Miami and most of coastal Florida. Sea-level rise also increases coastal erosion and the loss of coastal wetlands, and saltwater spoils freshwater drinking supplies. Coastal populations become even more vulnerable to storm surge and flooding. Considering that half of the world’s population lives near coasts, sea-level rise is a serious concern.
High Projection New Orleans, Shanghai, and other low-lying cities largely underwater Mean Sea-Level Rises (centimeters) Medium Projection More than a third of U.S. wetlands underwater Low Projection Year Fig. 20-10, p. 475
Rising Sea Levels • Changes in average sea level over the past 250,000 years based on data from ocean cores. Figure 20-9
Today’s sea level Height above or below present sea level (meters) Height above or below present sea level (feet) Years before present Present Fig. 20-9, p. 475
Rising Sea Levels • If seas levels rise by 9-88cm during this century, most of the Maldives islands and their coral reefs will be flooded. Figure 20-11
Changing Ocean Currents • Global warming could alter ocean currents and cause both excessive warming and severe cooling. Figure 20-12
Warm, shallow current Cold, salty, deep current Fig. 20-12, p. 476