Download
1 / 13
160 likes | 323 Vues
Datos Univariados Medidas de Tendencia Central. Media Aritmética. mean(x). Mediana. median(x). 50 %. 50 %. Moda. a ,b, a ,...., a ,x,g,b,i, a ,...., a ,q,p, a ,z,s,x. sort ( table (x)). Media armónica. 1/mean(1/x). Media geométrica. prod (x)^(1/ length (x)). Datos Univariados

E N D
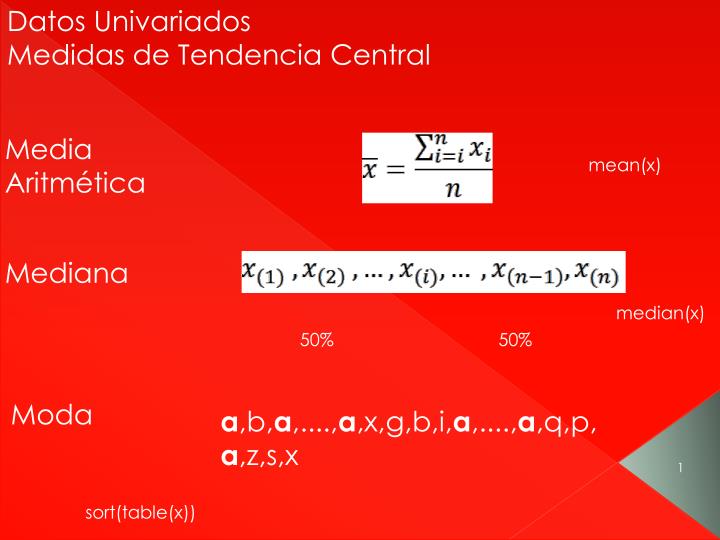
Datos Univariados Medidas de Tendencia Central Media Aritmética mean(x) Mediana median(x) 50% 50% Moda a,b,a,....,a,x,g,b,i,a,....,a,q,p,a,z,s,x sort(table(x))
Media armónica 1/mean(1/x) Media geométrica prod(x)^(1/length(x))
Datos Univariados Medidas de Dispersión o Variabilidad Varianza var(x) Desviación estándar sd(x) Coeficiente de variación sd(x)/abs(mean(x)) Error Estándar sd(x)/sqrt(length(x))
Datos Bivariados Medidas Variabilidad conjunta Covarianza Correlación
Datos Univariados Medidas de Dispersión o Variabilidad Rango, amplitud o ámbito max(x)-min(x) Percentiles Percentil P (100-P) % P % 1er. Cuartil 25 % 75 % 3er. Cuartil 75 % 25 % quantile(x,0.4) quantile(x,seq(0,1,0.1))
Índice IMECA zona noreste del DF 14_imeca.r Fuente: Dir. de Monitoreo Atmosférico Secretaria de Medio Ambiente GDF 5 de junio de 2012
Pingüinos Green, J. A., P. J. Butler, A. J. Woakes, I. L. Boyd and R. L. Holder. 2001. Heart rate and rate of oxygen consumption of exercising macaroni penguins. Journal of Experimental Biology 204: 673–684. 15_pinguinos.r
Lobos summary(dentadura) Min. 1st Qu. Median Mean 3rd Qu. Max. 9.70 10.10 10.30 10.32 10.50 11.20 16_lobos.r Whitlock, M. 1996. The heritability of fluctuating asymmetry and the genetic control of developmental stability. Proceedings of the Royal Society, Series B 263: 849-853.
Leones sd(age) [1] 2.676584 sd(proportion.black) [1] 0.198555 sd(age)/abs(mean(age)) [1] 0.6211073 sd(proportion.black)/abs(mean(proportion.black)) [1] 0.6162716 cov(age,proportion.black) [1] 0.419753 cor(age,proportion.black) [1] 0.7898272 17_leones.r Whitman, K., A.M. Starfield, H.S. Quadling and C. Packer. 2004. Sustainable trophy hunting of African lions. Nature 428: 175-178.
Emisiones totales de fuentes móviles en la Zona Metropolitana de la Ciudad de México 1998 datos_moviles.xlsx 18_contaminantes.r Fuente: Secretaria del Medio Ambiente, GDF, 1999
mean(datos) HC CO Nox PM10 SO2 28320.857 289014.286 20374.857 1221.429 789.000 sd(datos) HC CO Nox PM10 SO2 28319.4441 339397.2961 22024.5409 2361.0313 805.0832 cov(datos) HC CO Nox PM10 SO2 HC 801990915 9422074226 250450010 -4901465.8 19652056.3 CO 9422074226 115190524605 1652276129 -211270863.6 217857652.8 Nox 250450010 1652276129 485080403 45835453.2 12040235.7 PM10 -4901466 -211270864 45835453 5574469.0 517621.3 SO2 19652056 217857653 12040236 517621.3 648159.0 cor(datos) HC CO NOx PM10 SO2 HC 1.0000000 0.9802874 0.4015406 -0.0733060 0.8619508 CO 0.9802874 1.0000000 0.2210382 -0.2636510 0.7973035 Nox 0.4015406 0.2210382 1.0000000 0.8814403 0.6790275 PM10 -0.0733060 -0.2636510 0.8814403 1.0000000 0.2723138 SO2 0.8619508 0.7973035 0.6790275 0.2723138 1.0000000