Download
1 / 17
170 likes | 373 Vues
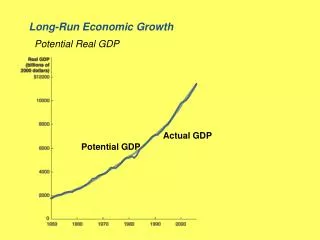
Determinants of long-term economic growth. Economic systems Economic policies Economic institutions. Explaining why growth rates differ. Questions.

E N D
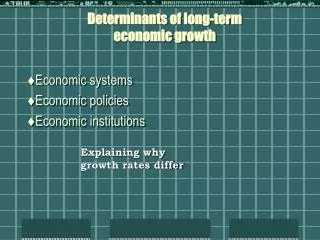
Determinants of long-termeconomic growth • Economic systems • Economic policies • Economic institutions Explaining why growth rates differ
Questions • If the economic systems adopted by two countries are not completely different, is it nonetheless possible to trace the differences in their economic performance to their different economic policies? • Or does technology dictate growth differentials in such cases? • Or perhaps geography? • Or history? • Or all of the above?
Examination of economic growth in theory and practice • Growth performance of four pairs orclusters of countriessince 1970 • Low-andmiddle-incomecountries • But most of the points to emerge apply to high-income countries as well • Those economies have developed quitedifferentlyover the past 30-40 years despite roughly comparableinitial conditions
The four clusters • Thailand and Burma • Botswana, Nigeria, and Ghana • Uruguay, Argentina, and Spain • Madagascar and Mauritius
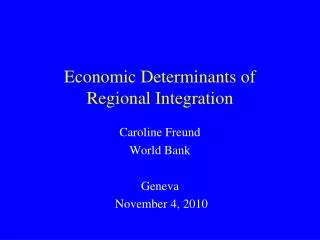
Burma 1962: General Ne Win came to power ‘victorious march towards socialism’ self-reliance but active client of IMF 1970s: respectable growth rising investment centrally planned poor quality stagnant export 1980s: something had gone seriously wrong Thailand rising export ratio strong saving and investment performance banking system strongly influenced by politicians quality of investment questionable strong education record 1960-1994: GNP per capita increased by more than 5% per year on average compared with 1% in Burma Burma and Thailand
Burma and Thailand: GNP per capita, 1960-1994 (constant 1987 US$, 1960=100)
Burma spurts of rapid growth depressed investments of low quality plummeting exports deteriorating education evaporation of expertise political control of economic affairs Thailand The stock-market crash in 1997-8 not likely to dim long-run prospects Thailand’s growth prospects continue to look bright Thailand’s economy seems basically sound Burma and Thailand In 1990, Burma’s military junta refused to abide by the general election victory of the opposition, led by Aung San Suu Kyi Rapid growth over the long haul does not always have to be smooth In 1996, the universities were shutdown
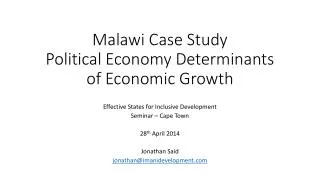
Botswana world record in growth GDP per capita has grown by 7.5% per year since 1966 dependent on natural resources - diamonds 80% of exports 40% of GDP democratic well-managed resources strong education stable economic development 11% average inflation rate Nigeria oil price increase in world markets income per capita rose fourfold poor investment unproductive capital collapse of output low investment since 1980s oil exports crowded out non-oil exports (90% of total) natural resources: a mixed blessing? Botswana, Nigeria, and Ghana
Nigeria oil 80% of government revenue 20% of GDP ruled by military on and off 19% inflation on average Ghana model client of IMF and World Bank since 1980s increasing foreign trade increasing investment 1982 - a turning point exports of goods and services rising net foreign direct investment flowing into Ghana 3.6% of GDP in 1995 compared with 2.4% in Nigeria 36% inflation on average Botswana, Nigeria, and Ghana Abundant natural resource wealth can turn out to be, at best, a mixed blessing
Botswana, Ghana, and Nigeria: GNP per capita, 1970-1995 (current US$, Atlas method)
Uruguay abundant resources dedication to social security and social services South American welfare state active role of government protectionism declining GNP per capita today: quite closed economy rampant inflation Argentina gradual relative decline political development lagged behind economic progress landowners ruled the country blocking decentralization, democratization, and diversification away from agriculture hardening conflict between landowners and emerging urban classes gradual deterioration of living standards Uruguay, Argentina, and Spain Economic growth is relative
Argentina Perón president in 1946 high inflation rapid escalation of debt flawed economic policies import substitution overvaluation of the currency insufficient competition reduced foreign trade and dragged down living standards civil disorder, inflation, corruption, and brain-drain slow and uneven growth strikingly closed economy history of high inflation Spain joined the European Union in 1986 opened up its economy expanded exports Uruguay, Argentina, and Spain History matters for economic growth, as does politics ... ... and so does inflation
Argentina, Uruguay, and Spain: GNP per capita, 1970-1995 (current US$, Atlas method)
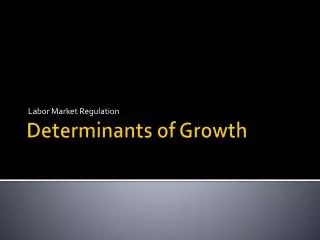
Mauritius mixed market economy since 1980: income per head has increased fast diversified economy more open to foreign trade and investment invests more farther along on its way from agriculture to industry, trade, and services sends more girls go to school Madagascar centrally planned economy since 1980: income per head has fallen growth differential between the two countries has been even larger since mid-1980s more inflation more dependent on exports of raw materials more indebted abroad Madagascar and Mauritius
Madagascar and Mauritius: GNP per capita, 1970-1995 (current US$, Atlas method)
Conclusion Country comparisons are not to be taken literally Intended to highlight some aspects of economic growth What do the examples have in common? All point toeconomic factors rather than exogenous technology economic system institutions orientation of economic policy Key distinction: Endogenous growth vs. exogenous growth This is the fundamental message of the theory of endogenous growth