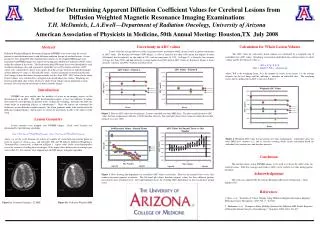
Geometric and ADC Uncertainty in Lesion Analysis
90 likes | 113 Vues
This study outlines the sources of uncertainty in geometric and apparent diffusion coefficient (ADC) measurements for lesion analysis. It discusses the uncertainty in lesion placement, voxel calculations, and ADC values, and provides statistical and percentage analysis.

Geometric and ADC Uncertainty in Lesion Analysis
E N D
Presentation Transcript
Outline • Geometric Uncertainty • Uncertainty in average intensity due to lesion placement • ADC uncertainty
Geometric Uncertainty • Uncertainty in number of voxels • Transcription from contour to DW image, 4 contour voxels for each DW voxel • Algorithm rounds to nearest voxel • Voxels in center of lesion certain • Voxels on perimeter of lesion uncertain • Estimate each DW voxel on average has +/- ¼ • Affects weighted calculation of whole lesion
Geometric uncertainty • Lesion geometry, roughly circular section • Area => n = πr2 • Perimeter => np = 2πr +/- ¼*(2πr ) • σn = πr/2 = √(n/ π) • For n = 150, σn ≈ 7 • Typical uncertainty about 2-3% • Doesn’t include 2-3% scaling from Contour to DW
Geometric uncertainty • Slice matching • Contour – 4mm slice, 4mm spacing • DW – 5mm slice, 7mm spacing • Not all contour slices have a matching DW slice • All DW slices have matching contour slice • DW slice overlaps contour slice
Lesion Placement • Estimated by placing ROI and analyzing histogram, then shifting and reanalyzing • Variation in average intensity for shifts of 1-2 pixels was about 2-3%
Uncertainty in ADC Values • Statistical uncertainty in image intensity • Statistical fluctuation • Structure (GM, WM, CSF) • Typically 15-30% • -ln(I/Io) => σ = √(0.152+0.152) ≈ 0.21 • Linear fit from fixed point and two points with uncertainty
Uncertainty in ADC Values • Uncertainty in linear fit from Bevington • σ2 = 1/Δ*Σ1/σi2 • Δ = Σ 1/σi2* Σxi2/ σi2-(Σ xi/ σi2)2 • e.g. for σ2=σ3=.2, x2=520, x3=850 • Δ = (1/.04 +1/.04)*(5202/.04+8502/.04)-(520/.04+850/.04)2 = 6.8e7 • σ = √(1/6.8e7*(1/.04+1/.04)) = 0.00086 • ADC ≈ 0.0015 +/- 0.00086 (57%)
ADC uncertainty Patient 5 • Minimum +/-43% • Maximum +/-215% • Average +/-104%