(a)
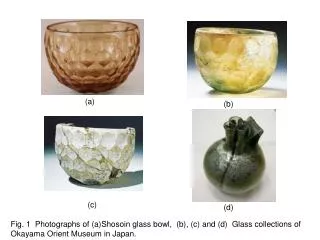
(a). (b). (c). (d). Fig. 1 Photographs of (a) Shosoin glass bowl, (b ), ( c) and (d) Glass collections of Okayama Orient Museum in Japan. Vacuum sample chamber. Water cooling system for SDD detector.

(a)
E N D
Presentation Transcript
(a) (b) (c) (d) Fig. 1 Photographs of (a)Shosoin glass bowl, (b), (c) and (d) Glass collections of Okayama Orient Museum in Japan.
Vacuum sample chamber Water cooling system for SDD detector Fig. 2 A portable XRF spectrometer set up at the Damascus National Museum analyzing Roman glass excavated from Syria
K2O+MgO K2O-SiO2 Na2O-CaO-SiO2 (plant ash) Na2O-Al2O3-CaO-SiO2 Al2O3/3 CaO/3 Fig. 3 Triangular plotfor classification of the glass beads based on compositional characteristic of raw materials
Fig. 4 Raman spectrum of yellow green glass bead from Odara with a photo of the pigment in the glass analyzed
Plant-ash glass Natron glass Fig. 5 K2O vs. MgO plot based on the analyzed data of glass samples unearthed from the Raya/al-Turarea. TD represents the data of the Toshodaiji glass.
PA-1 PA-2 MgO/CaO = 0.5 Fig. 6 CaO vs. MgO plot based on the analytical data of plant ash glass unearthed in the Raya al-Tur area.TD represents the data of the Toshodaiji. glass.
Andaman sea Ko Kho Khao Laem Pho Gulfof Thailand KhuanLukpad Fig.7 Map of Thailand showing the historical sites of KoKhoKhao, Laem Pho, and KhuanLukpad in the Malay Peninsula
(a)LP 6 (b)KKK 21 (c)RG-1913 (d)RG-322 Fig. 8 Glass fragments showing similarities in appearance between glass from Thailand (a),(b) and those from Egypt
FeKa Si Ka Ca Ka K Ka Co Ka Fe Kb Cl Ka Mn Ka Ca Kb Ti Ka Zn Ka Na Ka Mg Ka Al Ka Cu Ka Sr Ka Zr Ka Pb Lb Pb La Zn Kb * * Fig. 9 A comparison of XRF spectra between glass from Thailand (LP06, KKK21) and those from Egypt (RG-1913,RG-322)