Download
1 / 27
270 likes | 425 Vues
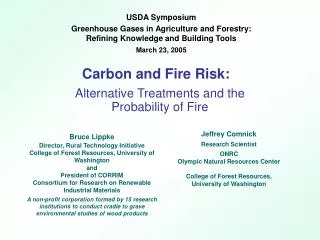
USDA Symposium Greenhouse Gases in Agriculture and Forestry: Refining Knowledge and Building Tools March 23, 2005. Carbon and Fire Risk:. Alternative Treatments and the Probability of Fire. Jeffrey Comnick Research Scientist ONRC Olympic Natural Resources Center

E N D
USDA Symposium Greenhouse Gases in Agriculture and Forestry: Refining Knowledge and Building Tools March 23, 2005 Carbon and Fire Risk: Alternative Treatments and the Probability of Fire Jeffrey Comnick Research Scientist ONRC Olympic Natural Resources Center College of Forest Resources, University of Washington Bruce Lippke Director, Rural Technology Initiative College of Forest Resources, University of Washington and President of CORRIM Consortium for Research on Renewable Industrial Materials A non-profit corporation formed by 15 research institutions to conduct cradle to grave environmental studies of wood products
Background • The CORRIM report estimated the carbon storage contribution from three pools linked to the forest • In the Forest pool • In wood products pool (net of energy used and biofuel produced) • Avoided fossil intensive product pool • A major conclusion was that the highest leverage use of wood is in long lived products that substitute for fossil intensive products • A second conclusion was the shortest and most intensive rotations that produce long lived products stores the most carbon
Life Cycle Assessment of Wood Products & Buildings O O CO CO Air Emissions 2 2 2 2 SUN SUN Log Log Construction Production Management & Harvest Water & Land Emissions
“Cradle” Forest Resources & Harvesting PNW and SE • Processing of Structural Materials • PNW and SE • Lumber • Plywood • Glulam • LVL • I-joists • OSB (SE only) “Gate-to-Gate” • Construction of Virtual Residential Buildings to Code • Minneapolis wood and steel designs • Atlanta wood and concrete designs Building Use and Maintenance Disposal or Recycle Life Cycle Inventories: measure all inputs & outputs Emissions Effluents Materials Solid Waste Energy Products Co-products Water “Grave”
Carbon in PNW Forest Pools 80-Year Rotation with Two Thinnings
Carbon in Product Pools Processing Energy and Displacement
Summary Performance Indices Atlanta House vs. Above-grade Wall
Carbon in Forests, Productsand Concrete Frame Substitutes Averages over time intervals
Problem • This raises several interesting questions for carbon strategy in the Inland West. • What is the impact of fire which eliminates the opportunity to produce products and also impedes regeneration and productivity. • Should the Inland West produce long lived product or biofuels • Knowing the carbon impact after a range of fire risk reduction treatments (NA, BA45, 9&Under, 12&Up, & Wildfire) is not sufficient. • We need to know the expected value of carbon which depends upon the probability of fire as a function of the treatment. • We also need to know the likelihood of producing long lived engineered products vs. biofuel
Methods applied to Okanogan FIA data • Average per acre metric tons of carbon were calculated for each 5-year time period from 1995 to 2030 for NoAction(NA), BA45, 9&Under, 12&Up, and Wildfire treatments. • Fire risks were estimated using the FVS Fire and Fuel Extension (FFE model) and categorized as Hi, Moderate or Low risk. • Probability of fire was computed/calibrated at 17% per 5 year period to result in 15% unburned refugia after 50 years based on prior studies. • 17% of the acres at high risk were burned each period, 8% at moderate risk and 0 % for low risk. • Composite carbon totals through time were calculated as a percentage of acres treated and whether unburned or burned. • All treatments occurred in 2000 or were phased in; Fire occurred each time period.
Assumptions • Low risk acres don’t burn (or low intensity fire) • High and Moderate risk acres can only burn once in the period • After a fire on High and Moderate risk acres the carbon remaining is estimated from post-fire residual stands: • higher in the north (Okanogan) • lower in the south (Fremont) • Regeneration is assumed and may be excessive (many burned stands may actually be ready for a second burn) • Snags are decayed (no salvage)
Acres burned each period:Okanogan with Regeneration Increase in high risk acres
Acres unburned :Okanogan with Regeneration Increase in high risk acres
NA No Fire NA Fire 12 & Over No Fire 12 & Over Fire 9 & Under No Fire 9 & Under Fire BA45 No Fire BA45 Fire
NA No Fire NA Fire 12 & Over No Fire 12 & Over Fire 9 & Under No Fire 9 & Under Fire BA45 No Fire BA45 Fire
Conclusions • Fire risk reduction treatments do increase carbon stored • 12 tonnes/acre but the accounting is complex • Treatment response time reduces benefits (limits reduction in acres burned & delays product carbon) • 9”&under barely reduces fire risk or cost • 12+&over produces highest net revenue but maintains high fire risk • Other non-mkt values (avoided costs) would reduce benefit • 45sfBA almost as good with fire fighting cost included • Better with other non-mkt benefits included
Support Acknowledgements • CORRIM- Consortium for Research on Renewable Industrial Materials • 15 research institutions and 23 authors • DOE & 5 companies funded the Research Plan • USFS/FPL, 10 companies & 8 institutions funded Phase I • PNW & SE product manufactures surveyed • USDA/CSREES National Research Initiative competitive grants program • EPA & Special grants for carbon links
The Details CORRIM: www.CORRIM.ORGAthena: www.athenaSMI.caLMS: http://LMS.cfr.washington.eduUSLCI database: www.nrel.gov/lci