Download
1 / 60
630 likes | 1.06k Vues
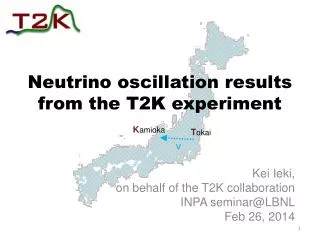
Neutrino oscillation results from the T2K experiment. K amioka. T okai. Kei Ieki, on behalf of the T2K collaboration INPA seminar@LBNL Feb 26, 2014. ν. Outline. Neutrino oscillation The T2K experiment Oscillation analysis Latest results. 1. Neutrino oscillation.

E N D
Neutrino oscillation results from the T2K experiment Kamioka Tokai Kei Ieki, on behalf of the T2K collaboration INPA seminar@LBNL Feb 26, 2014 ν
Outline • Neutrino oscillation • The T2K experiment • Oscillation analysis • Latest results
Neutrino oscillation The flavor of neutrino changes periodically as it propagates νe ν1 (m1) νμ ν2 (m2) = UPMNS × ντ ν3 (m3) time flavor eigenstates Mixing matrix(PMNSmatrix) mass eigenstates time Mixing matrix depends on the mixing angles θ12, θ23, θ13and the CP violating phase δCP. 1 0 0 0 0 UPMNS = 0 0 1 0 0 0 0 0 0 1 ()
What we already know θ12: ~34 θ23: ~45 θ13: ~9 δCP: unknown 0.55 0.16 0.82 UPMNS ~ 0.70 -0.50 0.52 -0.65 0.39-0.09 0.70 Oscillation probability also depends on mass splittings: = ~7.5×10⁻⁵ eV2, 2.4×10⁻³ eV2 mass hierarchy (sign of )is unknown.
What we already know θ12: ~34 θ23: ~45 θ13: ~9 δCP: unknown 0.55 0.16 0.82 UPMNS ~ 0.70 -0.50 0.52 -0.65 0.39-0.09 0.70 Oscillation probability also depends on mass splittings: = ~7.5×10⁻⁵ eV2, 2.4×10⁻³ eV2 mass hierarchy (sign of )is unknown. Unanswered questions • Is there a CP violation (δCP≠0) in the lepton sector? • Normal (>0) or inverted (<0) hierarchy? • Is θ23equal to π/4(maximal oscillation)? Precision measurement of neutrino oscillation is important!
Neutrino oscillation experiments Atmospheric neutrinos Reactor neutrinos Solar neutrinos p-p fusion chain nuclear fission νe νe θ12, θ23, θ12, θ13, Accelerator neutrinos δCP θ23, θ13,
Oscillation probabilities Reactor experiments ( from nuclear fission) • disappearance () Pure measurement of (: propagation length, : energy) Combining T2K and Reactor allows to measureδCP! T2K ( from accelerator) • appearance () ∝ roughly proportional to 1/ • disappearance () (sub-leading term)
Oscillation probabilities P(νμ→νe) P(νμ→νμ) 1 0.1 NH,δCP=0 IH,δCP=0 T2K ( from accelerator) NH,δCP=π/2 IH,δCP=π/2 Reactor experiments ( from nuclear fission) L=295km 0.5 0.05 sin2θ23=0.5, Δ=2.4×10⁻³ eV2 • disappearance () Pure measurement of L=295km (: propagation length, : energy) 0 • disappearance () 0 3 3 2 1 2 1 Eν(GeV) Eν(GeV) Combining T2K and Reactor allows to measureδCP! • appearance () ∝ roughly proportional to 1/ (sub-leading term)
The T2K collaboration Italy INFN, U. Bari INFN, U. Napoli INFN, U. Padova INFN, U. Roma Japan ICRR Kamioka ICRR RCCN Kavli IPMU KEK Kobe U. Kyoto U. Miyagi U. Edu. Osaka City U. Okayama U. Tokyo Metropolitan U. U. Tokyo Poland IFJ PAN, Cracow NCBJ, Warsaw U. Silesia, Katowice U. Warsaw Warsaw U. T. Wroklaw U. Russia INR Spain IFAE, Barcelona IFIC, Valencia Switzerland ETH Zurich U. Bern U. Geneva United Kingdom Imperial C. London Lancaster U. Oxford U. Queen Mary U. L. STFC/Daresbury STFC/RAL U. Liverpool Canada TRIUMF U. Alberta U. B. Columbia U. Regina U. Toronto U. Victoria U. Winnipeg York U. France CEA Saclay IPN Lyon LLR E. Poly. LPNHE Paris Germany Aachen U. U. Sheffield U. Warwick USA Boston U. Colorado S. U. Duke U. Louisiana S. U. Stony Brook U. U. C. Irvine U. Colorado U. Pittsburgh U. Rochester U. Washington ~500members, 59 Institutes, 11 countries
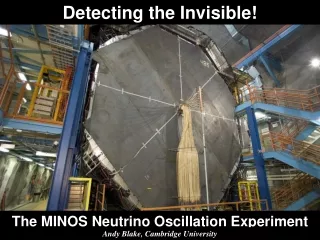
The T2K experiment • Discovery of νμ νe • We observed νμ νe with 7.3σ significance in 2013! • Precise measurement of νμ νμ Updated result reported on Feb 18 θ13, δCP Main goals θ23, Δ J-PARC μ 295km π+ p νμ νe,μ,τ ~40m Near Detector (ND280) Far Detector (Super-Kamiokande) High intensity νμ beam & giant water Cherenkov detector SK
J-PARC LINAC Near detectors 3 GeV RCS νμ beam to SK Fast Extraction production target Main Ring Synchrotron (30 GeV) J-PARC = Japan Proton Accelerator Research Complex
J-PARC neutrino beam Magnetic horns ND280 Decay volume Beam dump Muon monitor To SK p beam π+ μ+ νμ μ+ off-axis π+ carbon target INGRID νμ on-axis 0m 280m 118m • High intensity 30GeV proton beam Oscillation prob. • Pions are focused by magnetic horns • Off-axis beam: direction of the beam is shifted by ~2.5 degrees. Energy spectrum peaked at oscillation maximum. BG ν interaction modes for νμνeat high energy are reduced. ν energy spectrum
ν detection at near/far detectors In the oscillation analysis, neutrinos are detected through Charged Current (CC) interactions. • Main interaction mode in T2K • Eν can be reconstructed frompl and θl ● CCQE(Charged Current Quasi Elastic) ν-Ncross section ● CC1π (Charged Current 1π) Total CCother CC1π (res) CCQE NC other ● NC1π0(Neutral Current 1π0) NC1π0 (res) T2K νμ flux (no osc.) Uncertainty of the cross sections strongly affects the oscillation analysis.
Near detectors Measures the neutrino beam at 280m downstream from the neutrino production target ● ND280 (off-axis) ν beam flux & cross section measurement ● INGRID (on-axis) ν beam direction, stability measurement
INGRID Monitor n beam profile/rate. νμ μ ~10m Beam center 1.5m • Large mass & large volume • 16 identical modules (14 in cross) • Iron/scintillator layers ~10m
ND280 Combination of many detectors to measure ν beam flux & cross section. μ νμ TPC3 TPC1 TPC2 FGD2 FGD1 +SMRD FGD TPC 0.2T magnet - Scintillator bars (~1 ton for FGD1) - νtarget & tracking - Time Projection Chambers - 3D tracking, momentum measurement, PID
Super-Kamiokande (SK) Measure ν interactions after oscillation. • 50 kton water Cherenkov detector (FV: 22.5 kton)1000m underground Kamioka mine • Identify e/μ from Cherenkov ring shape 1-ring e-like/μ-like events are selected for νμ→νe/νμνμanalysis. ~40m e- -like -like Outer detector ~2000 8’’ PMTs (veto external BG) Inner detector ~11100 20’’ PMTs e μ
Brief history of T2K • 6.6×10²⁰ protons on target (~8% of the final goal) collected/analyzed. • Beam power has steadily increased and reached 220kW continuous operation with a world record of 1.2×10¹⁴ protons per pulse.
Brief history of T2K ● First indication of νμ→νe (Significance to exclude θ13=0: 2.5σ) PRL107,041801 (2011) ● “Evidence” of νμ→νe (Significance: 3.1σ) PRD 88, 032002 (2013) ● “Discovery” of νμ→νe (Significance: 7.3σ) PRL 112, 061802 (2014) ● Updated νμ→νμ world’s best θ23 measurement (paper will beready soon) ● Updated νμ→νμ result PRL 111, 211803 (2013) ● First νμ→νμ result from T2K PRD 85, 031103 (2012)
Stability of the beam • Neutrino rate per POT is stable to 0.7% over run period • Neutrino beam direction is stable < 1mrad (<2% shift in the ν energy) over run period Stability of ν interaction rate normalized by # of protons (INGRID) Stability of ν beam direction (INGRID) Note: Dataset includes 0.21x10²⁰ POT with 250 -> 205kA horn operation (13% flux reduction at peak)
Overview of the analysis ① flux, -N interaction prediction ② Constraints from external data ③Constraints from ND280 ④ SK event selection MC Data Comparison of SK events ⑤Oscillation analysis
①,② Flux & interaction prediction i) ν flux prediction ● Flux simulation Hadron production prediction is weighted so that interactions match external data. (NA61/SHINE, Eitchen et al., Allaby et al.)
①,②Flux & interaction prediction i) ν flux prediction Near (ND280) and Far (SK) fluxes are highly correlated SK flux can be constrained by ND280 measurement Flux SK/ND280 correlation ● Predicted flux Predicted flux (SK) peaked around 0.6 GeV ~1% of νe (BG for νμ→νe) overlaid plot Predicted flux (ND280)
①,②Flux & interaction prediction i) ν flux prediction SK flux has 10-15% uncertainties from 0.1 to 5 GeV ● Systematic errors Systematic errors Systematic error sources
①,②Flux & interaction prediction ii) ν-N interactionprediction ν-Ncross section ● Interaction simulation NEUT simulation code - Cross section prediction for different interaction modes: CCQE, π production via resonance (CC1π, NC1π) etc. - Fermi-Gas model for nuclei - FSI: Interactions of hadrons in the final state (π absorption etc.) Total CCother CC1π (res) CCQE NC other NC1π0 (res) T2K νμ flux (no osc.) W N
①,②Flux & interaction prediction ii) ν-N interactionprediction ● Systematic parameters We use effective parameters (axial mass form factor MA, normalization parameters etc.) with uncertainties that span the base model and data, and allow the ND280 to constrain the model. Past measurements of MAQE Axial form factor: Parameters (CCQE)
①,②Flux & interaction prediction ii) ν-N interactionprediction ● Systematic parameters Parameters (resonant π) For the resonant π production models, we use MiniBooNE data and fit to NEUT predictions. CC1π+ NC1π0
③ Constraints from ND280 We measure the muon momentum and angular distributions in three samples. Constrain the uncertainties for different interaction modes CC other CC0π CC1π+ μ + hadrons μ μ+ π+ TPC2 TPC3 TPC1 FGD2 FGD1 CC0π μ momentum CCother μ momentum CC1π+ μ momentum DIS Resonant π CCQE Deep Inelastic Scattering (DIS)
③ Constraints from ND280 We fit the muon momentum and angular distributions to constrain the flux × cross section. CC other CC0π μ momentum distribution Data Before fit After fit CC1π
③ Constraints from ND280 Cross-section parameters SKnm flux • ND280 fit reduces both flux and cross-section model uncertainties individually • Flux and cross-section parameters are anti-correlated after these fits because the constraint is a rate at ND280
④ SK event selection νμ→νμ νμ T2K beam timing & Fully contained(no activities in OD) Inside fiducial volume (>2m from wall) 1 μ-like Cherenkov ring Reconstructed μ momentum > 200MeV/c(for good μ/e separation) Number of decay electron (μe) ≤1 μ 5. Decay electrons ≤ 1 2. 1 μ-like ring cut e-like m-like
④ SK event selection νμ→νe T2K beam timing & Fully contained(no activities in OD) Inside fiducial volume (>2m from wall) 1e-like Cherenkov ring Visible energy Evis > 100MeV/c(Evis : electron energy deposit in ID)Reject NC BG, decay e from μ) Number of decay electron (μe)= 0 Reconstructed ν energy Erec < 1250 MeV(Suppress intrinsic νe contamination in the νμbeam ) NCπ0 BG rejection cut 4.Visible energy cut 6.Erec<1250 MeV cut Next page
④ SK event selection νμ→νe NCπ0 background ●NCπ0 rejection cut e-like ring undetected Old method Force to find the second ring, based on the PMT charge information. Invariant mass of π0 is required to be less than 105 MeV/c2. fiTQun NCπ0 rejection New method (2013~) ln() Use new event reconstruction algorithm “fiTQun”. It is a likelihood fit which determines all of the track parameters (position, momentum, particle ID) at the same time, based on the timing and charge of the PMTs. New cut reduces NCπ0 BG by ~70%, with only 2% loss of the signal. select π0 invariant mass (MeV/c2)
νμνμmeasurement Updated result reported on Feb 18! (3.01×10206.57×1020 POT) Observed 120 νμ candidate events. Expected νμ events (no osc.): 446±23 events Ratio to no oscillations νμ energy spectrum
νμνμmeasurement Eν distribution with errors Expected number of events w/o ND280 constraint w/ ND280 constraint (sin2q23, Dm232)=(0.5, 2.4×10⁻³ eV2) events Observed: 120 Systematic errors on number of νμ events Reconst. E (GeV) * The dominant uncertainties affecting T2K Dm232 precision such as binding energy/SK energy scale are not shown in the left table of # of events since they don’t affect overall normalization. (assuming δCP=0, sin2θ23=0.5, Δ=2.4×10⁻³eV2/c4)
νμνμ measurement Multi-nucleon systematic error • Lively discussion motivated by CCQE cross section inconsistency between MiniBooNE/other experiment • Not incorporated directly into analysis • But we have a large systematic uncertainty (100%) on decays of D resonances w/ prompt p absorption (“p-less D-decay”). It has similar impact on neutrino energy reconstruction as a 100% uncertainty in the multi-nucleon interaction model (Nieves model) • Dedicated MC study shows the impact on oscillation analysis is small relative to our current statistical error.
νμνμ measurement Multi-nucleon systematic error • Lively discussion motivated by CCQE cross section inconsistency between MiniBooNE/other experiment • Not incorporated directly into analysis • But we have a large systematic uncertainty (100%) on decays of D resonances w/ prompt p absorption (“p-less D-decay”). It has similar impact on neutrino energy reconstruction as a 100% uncertainty in the multi-nucleon interaction model (Nieves model) • Dedicated MC study shows the impact on oscillation analysis is small relative to our current statistical error.
νμνμfit method Maximum likelihood fit based on: • Number of νμ events • distribution = norm × shape × syst × osc Osc. param. Enrecdist. Syst. # of events Data Data Best fit Best fit Depth: sin22q23 No oscillation Position:Dm232 Note: sin2q13, sin2q12, Dm221 are constrained by PDG2012. dCPis unconstrained.
νμνμ result Best fit: (sin2q23, D)=(0.514, 2.51×10⁻³eV2) (sin2q23, D)=(0.511, 2.48×10⁻³eV2) Normal hierarchy (NH) Inverted hierarchy (IH) 2D confidence regions 1D intervals [NH] Previous T2K result PRL 111, 211803 (2013) T2K new Great improvement from the previous T2K result! T2K favors maximal mixing
νμνμresult Comparison w/ other experiments Inverted hierarchy Normal hierarchy T2K measures q23 with the world-leading precision!
νμνemeasurement Observed 28 νe candidate events. Expected backgrounds: 4.9±0.6 events Reconstructed νe energy distribution T2K νμ flux 1000 0 500 Energy (MeV)
νμνemeasurement Expected number of events NCπ0 BG: 0.9 Intrinsic νe contamination BG: 3.4 Observed: 28 Systematic errors on number of νe events (assuming δCP=0, sin2θ23=0.5, Δ=2.4×10⁻³eV2/c4)
νμνefit method Maximum likelihood fit based on: e- • Number of νe events • (pe, θe) distribution θe νe = norm × shape × syst × osc sin22θ13=0.1 (CCQE dominated) Osc. param. (pe,θe) dist. Syst. # of events 180 distribution 120 P(νμνe) = sin22θ13sin2θ23sin2 +(CPV term)+… (degrees) sin22θ13=0.0 (BGonly) 60 0 400 800 1200 (MeV/c) 0 0 400 800 1200 (MeV/c) Note: sin2q23, are constrained by T2K νμνμmeasurement with 3.01×10²⁰ POT.
νμνeresult (sin22θ13) Electron momentum and angular distribution Best fit for normal (inv.) hierarchy: sin22θ13 = () (Assuming δCP=0. sin2θ23 and Δ are constrained by T2K νμνμ measurementwith 3.01×10²⁰POT) Significance to exclude θ13=0:7.3σ (6.57×10²⁰ POT, normal hierarchy) “Discovery” of νμνe
νμνe result (δCP vs. sin22θ13) 68% and 90% allowed region of sin22θ13 for each value of δCP Fit performed for different values of δCP. Normal hierarchy (sin2θ23 and Δ are constrained by T2K νμνμmeasurement with 3.01×10²⁰ POT) (sin22θ13=0.098±0.013) Inverted hierarchy NOTE: These are 1D contours for various value of δCP, not 2D contours
νμνeresult, combined with reactor Combined with reactor measurement (sin22θ13=0.098±0.013 from PDG2012) δCP negative log likelihood curve Regions above these lines (derived by Feldman-Cousins method) are excluded with 90% C.L. 90% CL excludedregion Normal hierarchy: 0.19π~0.80π Inverted hierarchy: π~0.97π, 0.04π~π 90% excluded regions Best fit This is an important step towards the discovery of CP violation in the lepton sector!