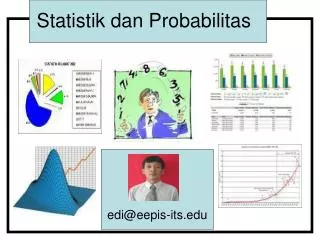
PROBABILITAS DAN STATISTIK
PROBABILITAS DAN STATISTIK. Pendeskripsian Data. Tabel Diagram Grafik. Sebaran frekuensi. Data yang telah dikelompokan. Tabel 1. Sebaran frekuensi bagi bobot 50 potong koper. batas atas kelas. batas bawah kelas. Limit kelas bawah. Limit kelas atas. Tabel 2. Umur aki mobil.

PROBABILITAS DAN STATISTIK
E N D
Presentation Transcript
Pendeskripsian Data • Tabel • Diagram • Grafik
Sebaranfrekuensi • Data yang telahdikelompokan
Tabel 1. Sebaranfrekuensibagibobot 50 potongkoper batasataskelas batasbawahkelas Limit kelasbawah Limit kelasatas
Tabel 2. Umurakimobil Cara penyusunandaftarsebaranfrekuensi • Tentukanberapabanyakkelas (b) yang akandiambil (biasanyabanyaknyaselangkelasdiambilantara 5 – 20). Kita ambil 7 selanguntukilustrasiini. Jadikitaperoleh b=7. • Tentukanlebarkelasbagiwilayah (R) data. Wilayah nyaadalah 4.7 – 1.6 = 3.1 • Tentukanlebarkelas (p). Lebarkelas • Tentukan limit bawahkelasbagiselang yang pertamadankemudianbatasbawahkelasnya. Dalamhalini limit bawahkelasadalah 1.5 danbatasbawahkelasnyaadalah 1.45
Tabel 3. Sebaranfrekuensiumuraki. 1.5 1.9 1.45 1.95 1.7 2 2.0 2.4 1.95 2.45 2.2 1 2.5 2.9 2.45 2.95 2.7 4 3.0 3.4 2.95 3.45 3.2 15 3.5 3.9 3.45 3.95 3.7 10 4.0 4.4 3.95 4.45 4.2 5 4.5 4.9 4.45 4.95 4.7 3 histogram poligon diagram
Penyajiangrafik • Lebihmudahmenangkapinformasi • Memahamiciri-ciripenting yang adapadasuatusebaranfrekuensi
frekuensi Umuraki (tahun) Gambar1. Diagram balok tabel
frekuensi Umuraki (tahun) Gambar 2. Histogram frekuensi tabel
frekuensi Umuraki (tahun) Gambar 3. Poligonfrekuensi tabel
frekuensi Umuraki (tahun) Gambar 4. Ogiffrekuensi tabel