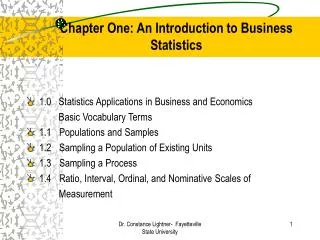
Chapter One: An Introduction to Business Statistics
270 likes | 729 Vues
Chapter One: An Introduction to Business Statistics. 1.0 Statistics Applications in Business and Economics Basic Vocabulary Terms 1.1 Populations and Samples 1.2 Sampling a Population of Existing Units 1.3 Sampling a Process

Chapter One: An Introduction to Business Statistics
E N D
Presentation Transcript
Chapter One: An Introduction to Business Statistics • 1.0 Statistics Applications in Business and Economics Basic Vocabulary Terms • 1.1 Populations and Samples • 1.2 Sampling a Population of Existing Units • 1.3 Sampling a Process • 1.4 Ratio, Interval, Ordinal, and Nominative Scales of Measurement Dr. Constance Lightner- Fayetteville State University
Applications in Business and Economics • Accounting Public accounting firms use statistical sampling procedures when conducting audits for their clients. • Finance Financial analysts use a variety of statistical information, including price-earnings ratios and dividend yields, to guide their investment recommendations. • Marketing Electronic point-of-sale scanners at retail checkout counters are being used to collect data for a variety of marketing research applications. From Anderson, Sweeney and Williams Dr. Constance Lightner- Fayetteville State University
Production A variety of statistical quality control charts are used to monitor the output of a production process. • Economics Economists use statistical information in making forecasts about the future of the economy or some aspect of it. From Anderson, Sweeney and Williams Dr. Constance Lightner- Fayetteville State University
Basic Vocabulary Terms • Data are the facts and figures that are collected, summarized, analyzed, and interpreted. • Data can be further classified as being qualitative or quantitative. • The statistical analysis that is appropriate depends on whether the data for the variable are qualitative or quantitative. • In general, there are more alternatives for statistical analysis when the data are quantitative. Dr. Constance Lightner- Fayetteville State University
Qualitative data are labels or names used to identify an attribute of each element. • Qualitative data use either the nominal or ordinal scale of measurement. • Qualitative data can be either numeric or nonnumeric. • The statistical analysis for qualitative data are rather limited. Dr. Constance Lightner- Fayetteville State University
Quantitative data indicate either how many or how much. • Quantitative data that measure how many are discrete. • Quantitative data that measure how much are continuous because there is no separation between the possible values for the data.. • Quantitative data are always numeric. • Ordinary arithmetic operations are meaningful only with quantitative data. Dr. Constance Lightner- Fayetteville State University
The elements are the entities on which data are collected. • A variable is a characteristic of interest for the elements. • A qualitative variable is a variable with qualitative data. • A quantitative variable is a variable with quantitative data. Dr. Constance Lightner- Fayetteville State University
Example Stock Annual Earn/ Company Exchange Sales($M) Sh.($) Dataram AMEX 73.10 0.86 EnergySouth OTC 74.00 1.67 Keystone NYSE 365.70 0.86 LandCare NYSE 111.40 0.33 Psychemedics AMEX 17.60 0.13 Observation Variables From Anderson, Sweeney and Williams Elements Data Set Datum Dr. Constance Lightner- Fayetteville State University
Short Exercise In the previous example determine which variables are qualitative and which are quantitative. Ans: Stock exchage is qualitative. Annual Sales and Earn/Shares is quantitative. Dr. Constance Lightner- Fayetteville State University
Populations and Samples • The population is the set of all elements of interest in a particular study. • A sample is a subset of the population. Dr. Constance Lightner- Fayetteville State University
Random Sampling A procedure for selecting a subset of the population units in such a way that every unit in the population has an equal chance of selection. Since the validity of all statistical results depend upon the original sampling process, it is essential that this process is “blind”. This implies that every element in the population is equally likely to be selected for the sample without bias. Dr. Constance Lightner- Fayetteville State University
Populations and Samples Population Sample From Anderson, Sweeney and Williams Dr. Constance Lightner- Fayetteville State University
Descriptive Statistics and Statistical Inference Descriptive Statistics is tabular, graphical, and numerical methods used to summarize data. Dr. Constance Lightner- Fayetteville State University
Example: Hudson Auto Repair\ Descriptive Statistics The manager of Hudson Auto would like to have a better understanding of the cost of parts used in the engine tune-ups performed in the shop. She examines 50 customer invoices for tune-ups. The costs of parts, rounded to the nearest dollar, are listed below. From Anderson, Sweeney and Williams Dr. Constance Lightner- Fayetteville State University
Example: Hudson Auto Repair Descriptive Statistics Tabular Summary (Frequencies and Percent Frequencies) Parts Percent Cost ($)FrequencyFrequency 50-59 2 4 60-69 13 26 70-79 16 32 80-89 7 14 90-99 7 14 100-109 510 Total 50 100 From Anderson, Sweeney and Williams Dr. Constance Lightner- Fayetteville State University
Example: Hudson Auto Repair Descriptive Statistics Graphical Summary (Histogram) 18 16 14 12 Frequency 10 8 From Anderson, Sweeney and Williams 6 4 2 Parts Cost ($) 50 60 70 80 90 100 110 Dr. Constance Lightner- Fayetteville State University
Numerical Descriptive Statistics • The most common numerical descriptive statistic is the average (or mean). • Hudson’s average cost of parts, based on the 50 tune-ups studied, is $79 (found by summing the 50 cost values and then dividing by 50). From Anderson, Sweeney and Williams Dr. Constance Lightner- Fayetteville State University
Statistical Inference is the process of using information obtained from analyzing a sample to make estimates about characteristics of the entire population. Dr. Constance Lightner- Fayetteville State University
Example: Hudson Auto Repair • Process of Statistical Inference 1. Population consists of all tune-ups. Average cost of parts is unknown. 2. A sample of 50 engine tune-ups is examined. From Anderson, Sweeney and Williams 3. The sample data provide a sample average cost of $79 per tune-up. 4. The value of the sample average is used to make an estimate of the population average. Dr. Constance Lightner- Fayetteville State University
Scales of Measurement • Scales of measurement include: • Nominal • Ordinal • Interval • Ratio • The scale determines the amount of information contained in the data. • The scale indicates the data summarization and statistical analyses that are most appropriate. From Anderson, Sweeney and Williams Dr. Constance Lightner- Fayetteville State University
Scales of Measurement • Nominal • Data are labels or names used to identify an attribute of the element. • A nonnumeric label or a numeric code may be used. • Example: • Students of a university are classified by the school in which they are enrolled using a nonnumeric label such as Business, Humanities, Education, and so on. • Alternatively, a numeric code could be used for the school variable (e.g. 1 denotes Business, 2 denotes Humanities, 3 denotes Education, and so on). From Anderson, Sweeney and Williams Dr. Constance Lightner- Fayetteville State University
Ordinal • The data have the properties of nominal data and the order or rank of the data is meaningful. • A nonnumeric label or a numeric code may be used. • Example: • Students of a university are classified by their class standing using a nonnumeric label such as Freshman, Sophomore, Junior, or Senior. • Alternatively, a numeric code could be used for the class standing variable (e.g. 1 denotes Freshman, 2 denotes Sophomore, and so on). From Anderson, Sweeney and Williams Dr. Constance Lightner- Fayetteville State University
Interval • The data have the properties of ordinal data and the interval between observations is expressed in terms of a fixed unit of measure. • Interval data are always numeric. • Example: • Melissa has an SAT score of 1205, while Kevin has an SAT score of 1090. Melissa scored 115 points more than Kevin. From Anderson, Sweeney and Williams Dr. Constance Lightner- Fayetteville State University
Ratio • The data have all the properties of interval data and the ratio of two values is meaningful. • Variables such as distance, height, weight, and time use the ratio scale. • This scale must contain a zero value that indicates that nothing exists for the variable at the zero point. • Example: • Melissa’s college record shows 36 credit hours earned, while Kevin’s record shows 72 credit hours earned. Kevin has twice as many credit hours earned as Melissa. From Anderson, Sweeney and Williams Dr. Constance Lightner- Fayetteville State University
END OF Chapter 1 Dr. Constance Lightner- Fayetteville State University