Download
1 / 29
290 likes | 426 Vues
GEOG596A – Proposal for Capstone Project Creating Ice Drainage Divides of Antarctica using GIS Matthew Beckley Advisor: Peter Guth Senior Scientist: Mario Giovinetto. Table of Contents: Why is this important Review of Past Work Methodology Alternative Method

E N D
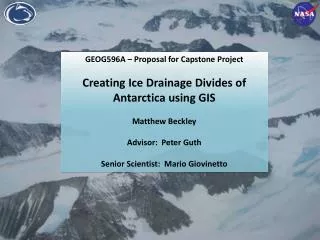
GEOG596A – Proposal for Capstone Project Creating Ice Drainage Divides of Antarctica using GIS Matthew Beckley Advisor: Peter Guth Senior Scientist: Mario Giovinetto
Table of Contents: • Why is this important • Review of Past Work • Methodology • Alternative Method • Potential roadblocks • Status
Why is this important? The Antarctic ice sheet contains approximately 70% of the world's fresh water, and has been undergoing dramatic changes in recent years. Image: RADARSAT Mosaic
Why is this important? • Need to break Ice Sheet into discrete units • Highlight areas of change • Ice Sheet vs Ice Shelf • Grounding line or “zone” in between.
Why is this important? B A • When base of ice is below sea level there is potential for instability A’ B’ A A’ Mean Sea Level B B’ Top Image: Landsat Image Mosaic of Antarctica (LIMA) Bottom images: Scott Polar Research Institute (SPRI)
Review of Past Work In previous years, drainage basins were created based on surface topography with radar altimetry from the GEOSAT and ERS-1 & 2 satellite missions. This was based on 5 kilometer grids.
Review of Past Work • Slope vectors colored by magnitude • Arrow direction indicates direction of max slope
Review of Past Work • ICESat launched in 2004. A lidar altimeter that produced large amounts of data. ICESat DEMs are 500 meter res. • This required a new approach to produce basins.
Methodology • Overview • Modify IDL code to create tiled slope vector maps. • Assist Senior Scientist in drawing divides in first round of edits. • Digitize in using ArcGIS. • Concatenate/edit/modify divides in ArcGIS. • Translate between IDL and GIS – reading/writing shapefiles in IDL • Edit divides using imagery and other data • Iterate the process for each of the tiles working towards a complete file for all of Antarctica. • Final products to include: • Divide polylines • Basin polygons for each of the basins • 500m Grid basin mask • Masks of terrain based on coastlines – designate floating ice, grounded ice, etc.
Methodology: Create tiled slope vector maps Due to increased resolution of Icesat DEM, the maps need to be tiled. Tiled maps were made in IDL.
Methodology: Concatenate, edit, & modify divides in GIS • Editing lines and nodes: • Make sure digitized lines are continuous. • Remove extraneous nodes, overshoots, undershoots, etc.
Methodology: Translate between IDL and GIS • Had to learn to read/write shapefiles in IDL to make this possible. • Colleagues work in IDL & UNIX environment. Non-GIS users. • Final product will have to be accessible via UNIX, Fortran, C, & IDL.
Methodology: Edit divides using imagery • The Power of GIS – Layering! • Helps assess problem areas. • Divides can be corrected based on what high resolution shows.
Methodology: Edit divides using imagery • Coastline, grounding line, and island data were manipulated using xtools to create polygons that were used for masking purposes. • Flowlines on imagery can guide divides. Slope vectors on ice shelves are difficult due to low slope.
Methodology: Edit divides using imagery Using RADARSAT imagery to clarify positions of divides relative to ice streams
Methodology: Edit divides using imagery High-res LIMA(15m) also useful for determining divides. Especially for locating rock points. Could be used to fine tune the divides – especially in the valley glacier areas.
Methodology: Edit divides using imagery • The benefits of using a GIS: • Icesat 500m DEM masked to coastline, layered transparently on a 15m LIMA image • High-res coastline converted to shapefile. • Preliminary divides on top ready for editing.
Methodology: Final Products With new basin polygons I can create a 500m basin mask 50 Km DEM masked to Radar-based basins 5 Km DEM masked to Radar-based basins
Alternative Methods Comparison Why not use ArcGIS basin toolset to save some work?? • Benefits of using GIS for basin creation: • Ability to layer data from various sources – the core of GIS • Ability to zoom in and out of problem areas without remaking maps. • Can provide a good “first-cut” at basin creation allowing time to spend on correcting problem areas along coast and mountain regions. • As future datasets become larger, it may become a necessity to use automated GIS algorithms and then focus corrections in key areas. • Problems with relying solely on GIS for basin creation: • Slopes, aspects, and basins can be overly complex for high resolution DEMS. • For some GIS programs, the algorithms are a “black box” – i.e. how they derive the values are unknown to the user. • Algorithms are still just a guide, and may not take other variables into account, especially for ice studies. Especially variables such as bedrock topography.
Alternative Methods Comparison • Aspects derived from the hybrid DEM. Divides show agreement for major ridges, but too confusing to use for work near the coast, or in moutainous terrain. • GIS basins derived from slopes and aspects are a mess.
Alternative Methods Comparison Have a headache yet?? Need a lot of editing to make the GIS products useful for analysis. GIS-derived aspects from ICESat DEM. Was used as a guide in some regions to determine divides. Mostly for main/obvious ridges.
Alternative Methods Comparison • Higher resolution Lidar DEMs - LVIS (Land, Vegetation, and Ice Sensor) • High altitude Lidar flown on DC-8 aircraft as part of Operation Ice Bridge. • 20 meter DEM draped on Google Earth imagery. • No interpolation! Nearest Neighbor gridding – raw data is at 20 meter spacings!
Potential Road Blocks • Overview • Projection issues. • Coastline disagreements. • Conflicting info – give ICESat precedence. • Missing data in the Pole region (south of 86S) • Masking – editing coastlines to form polygons. • ArcGIS Basin Tool – make subset grid. Get realistic basins?
Potential Road Blocks: Coastline Disagreements
Potential Road Blocks: Problem with the “Pole Hole” ICESat 500m DEM. Satellite only flew to -86 S, so there is no data to the south pole
Potential Road Blocks: Problem with the “Pole Hole” RAMP 200 DEM with Pole Data Based on RADARSAT data Downsample this DEM to 500m, reproject to match ICESat DEM.
Potential Road Blocks: Problem with the “Pole Hole” ICESat 500m DEM with RAMP data filling in the “pole hole” region.
Status • Digitizing is 90% completed. • Some coastline areas need to be examined with imagery. • Polygons need to be created based on divides. Potential topology issues have not been addressed yet. • Most roadblocks have been addressed, except for the inevitable basin tool peculiarities. • Need to create a subset grid and perform ArcGIS basin analysis/comparison.